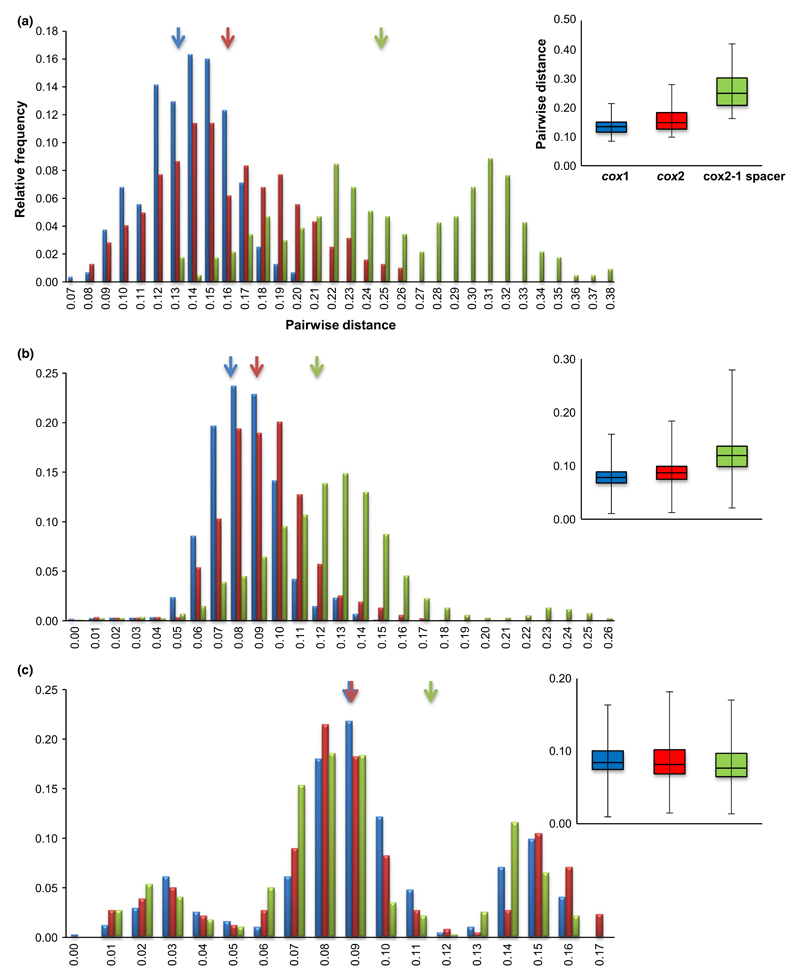
Fig. 4.
Distance histograms of the interspecific comparisons of cox1, cox2 and cox2-1 spacer sequences. Histograms display interspecific variation for 26 genera of Oomycete (a), 110 species of Peronospora (b) and 33 species of Bremia (c). Arrows point the overall mean pairwise distances for cox1 (blue), cox2 (red) and cox2-1 spacer (green). Box plots depict the variation for intra- and interspecific differences for the three markers. Black bar in the box indicates the median.

