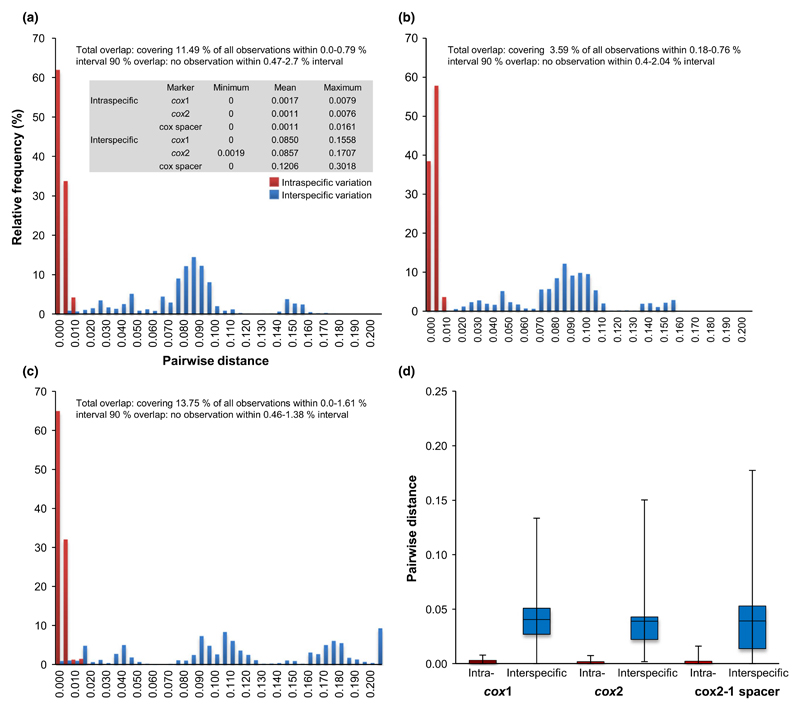
Fig. 5.
Distance histograms of the intra- and interspecific comparisons of cox1 (a), cox2 (b) and cox2-1 spacer (c) for Bremia species and boxplots (d) depicting the variation for the three markers. A table summarizes distance data. Black bar in the box indicates the median. Total overlap range (with corresponding percentage of observations it represents) and 90% overlap (largest 5% of the intraspecific and lowest 5% of the interspecific excluded) are indicated.

