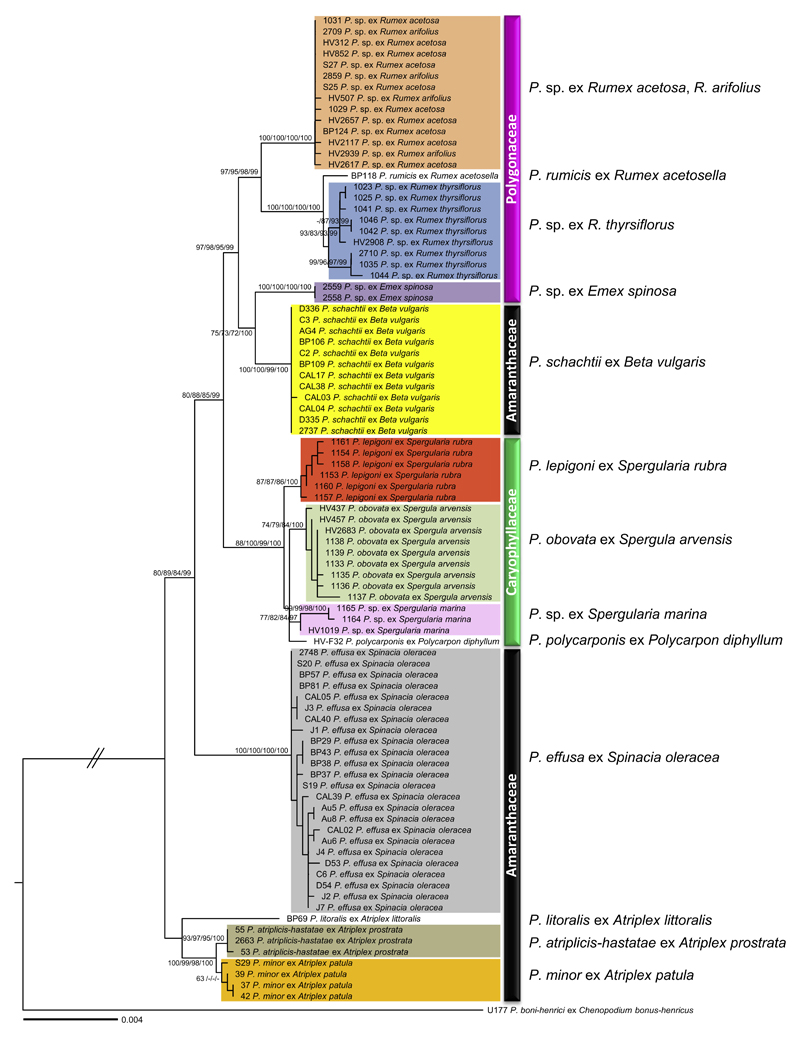
Fig. 1.
Phylogenetic tree inferred from Maximum Likelihood analysis of a concatenated alignment (4378 nucleotides with 123 parsimony informative sites) of five mitochondrial (cox2, coxS, cox1, nad1, rps10) and two nuclear loci (ITS and hsp90). Support values (ML BS/ME BS/ MP BS/MCMC PP) higher than 60% are given above or below the branches. The scale bar equals the number of nucleotide substitutions per site. Specimens originating from different host families are marked with black (Amaranthaceae), pink (Polygonaceae), and green (Caryophyllaceae) bars. ML: Maximum Likelihood, ME: Minimum Evolution, MP: Maximum Parsimony, MCMC: Bayesian inference, BS: Bootstrap support, PP: Posterior Probabilities. (For interpretation of thereferences to color in this figure legend, the reader is referred to the web version of this article.)

