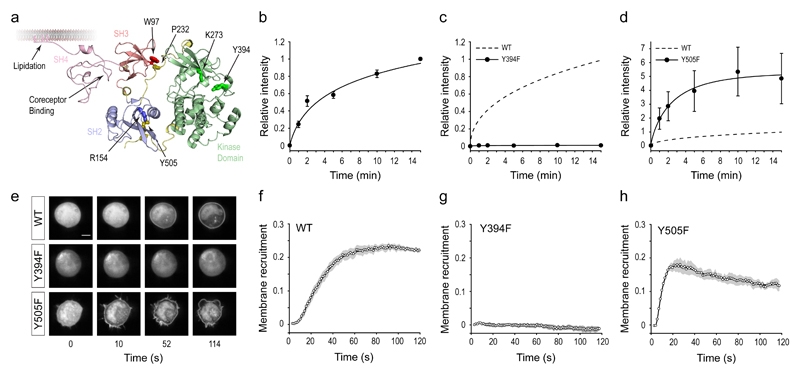
Figure 2. Phosphorylation of LCK active site loop is essential for its kinase activity.
(a) Cartoon representation of membrane-bound LCK showing key residues in the regulatory SRC-homology (SH) and kinase domains. Structure shown is based on the closely related kinase HCK (PDB: 1QCF) and Phyre2-modeled SH4 domain of LCK. Numbering is based on human LCK sequence. (b-d) Plots of ZAP70 Y319 phosphorylation kinetics by wildtype LCK* (b), Y394F LCK* (c) and Y505F LCK* (d), normalized relative to final time point (15 min) of wildtype LCK* (dashed curve). Data were fit using 3-parameter logistic function, and are presented as mean ± s.e.m. from independent experiments (n = 12 in b; 4 in c and d). (e) Representative microscopy images showing ZAP70 recruitment to the plasma membrane of HEK TCRH cells over time by different LCK* proteins, after photo-uncaging at 5 mW/cm2 for 2 s. Scale bar, 5 μm. (f-h) Quantification of microscopy data to measure ZAP70 recruitment to the plasma membrane over time by wildtype LCK* (n = 4) (f), Y394F LCK* (n = 3) (g) and Y505F LCK* (n = 4) (h). Data were collected using 4-8 cells per experiment, with data points represent mean and filled areas represent s.e.m. from independent experiments at each time point. A smoothed line using a moving-average filter is also shown.
Source data for graphs are in Supplementary Data Set 2.

