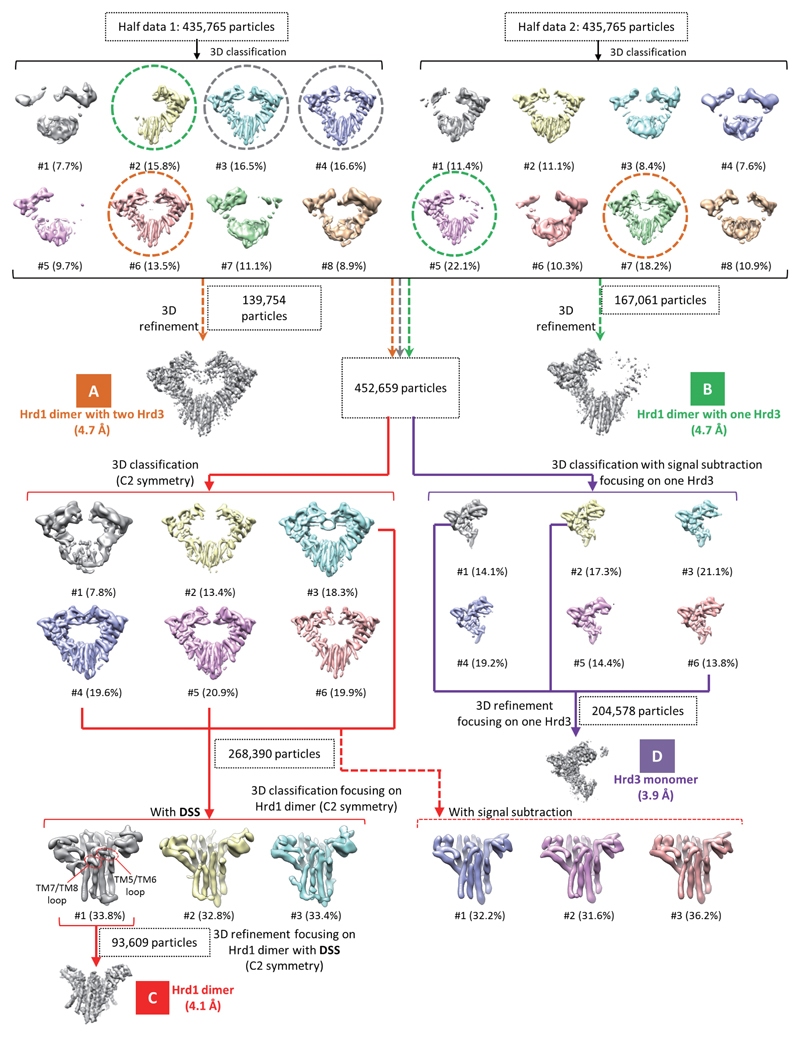
Extended Data Figure 2. 3D classification and refinement procedure for the Hrd1/Hrd3 complex.
Views parallel to the membrane of 3D reconstructions are shown, and percentages of the particles in each class indicated. Three different classes selected from the first round of 3D classification are encircled with dashed lines in different colors, and were used for further analysis, as indicated by correspondingly colored arrows. The four final maps are labeled A-D, and shown with the resolutions and particle numbers. Maps C and D were used for model building. To obtain the best 3D classification focusing on the Hrd1 dimer, we compared dynamic signal subtraction (DSS) and conventional signal subtraction. Only with DSS was particle class obtained that resulted in a reconstruction showing clear densities for the TM7/TM8 and TM5/TM6 loops of Hrd1.

