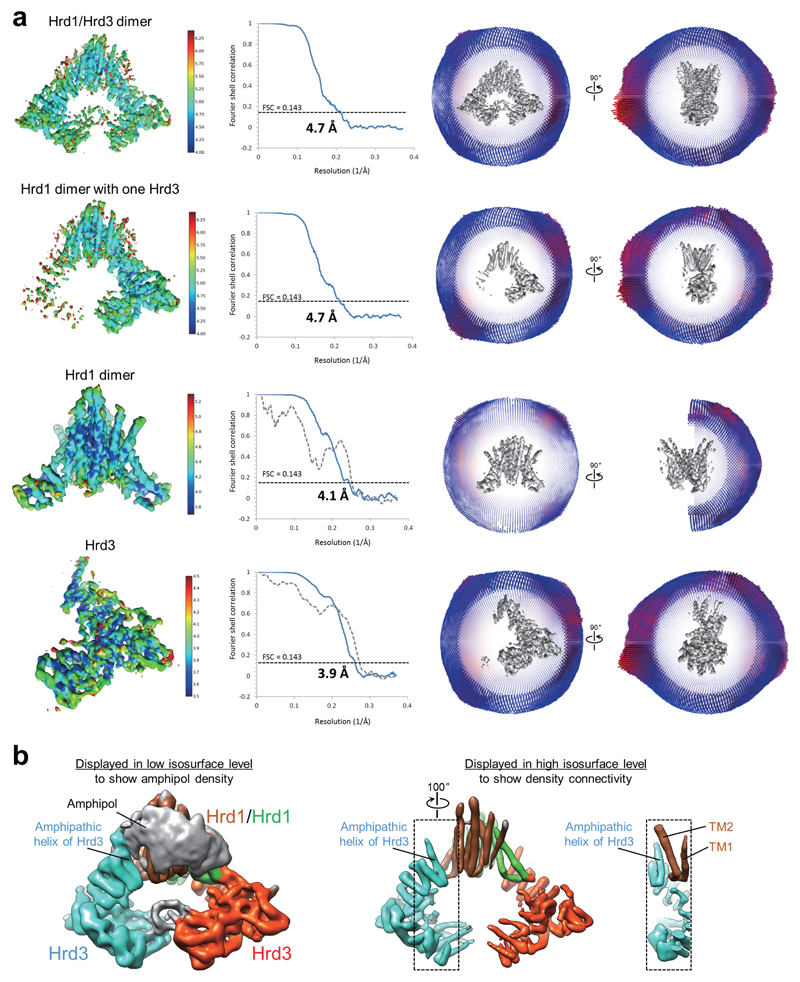
Extended Data Figure 3. Single particle cryo-EM analysis of Hrd1/Hrd3 complexes.
a, Density maps were generated for the Hrd1/Hrd3 dimer, the Hrd1 dimer with one associated Hrd3 molecule, the Hrd1 dimer, and Hrd3 (see Extended Data Fig. 2). The left panels show the maps in a side view, colored according to local resolution, the middle panels show the gold-standard Fourier shell correlation (FSC) curve (blue) with indicated resolution at FSC = 0.143, and the right panels show the Euler angle distribution in two different views. In the two lower panels, the dashed grey FCS curves were calculated between the atomic model and the corresponding final cryo-EM map. b, The density map for the Hrd1/Hrd3 dimer was filtered to a resolution of 6.8Å without amplitude modification, and is displayed at two different isosurface levels. At a low level (left panel), the weak amphipol density is visible and encloses the density of Hrd1 dimer. The amphipathic helix of Hrd3 only associates with the outer surface of amphipol density. At a high isosurface level (middle and right panels), the density for the amphipathic helix is clearly connected with that of the preceding Sel1 domains and well separated from that of TM1 and TM2 of the nearby Hrd1 molecule. The region in the dashed black box (middle panel) is displayed as a sectional view in the right panel.

