
Figure 1.
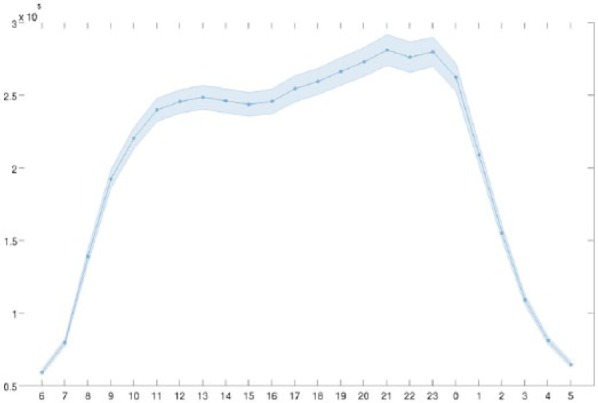
Word volume variation within the 24-h cycle, with 99% confidence interval. The y-axis represents the average volume per hour in the top 20,000 most frequent words across the 4 years.
Official websites use .gov
A
.gov website belongs to an official
government organization in the United States.
Secure .gov websites use HTTPS
A lock (
) or https:// means you've safely
connected to the .gov website. Share sensitive
information only on official, secure websites.
Word volume variation within the 24-h cycle, with 99% confidence interval. The y-axis represents the average volume per hour in the top 20,000 most frequent words across the 4 years.