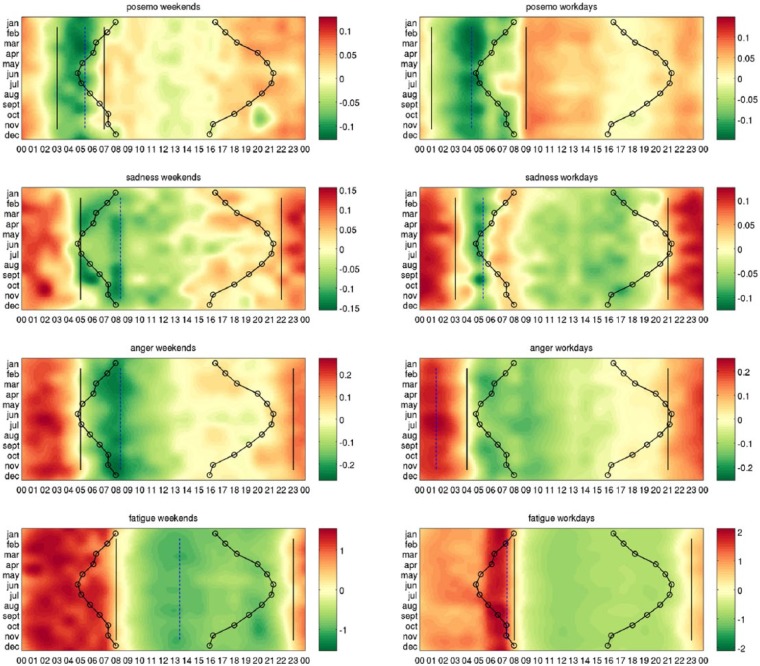
Figure 7.
Extrema and change-points in each emotion and in fatigue – the heatmaps show times of higher and lower expression in posemo, sadness, anger, and fatigue. Each row of the heatmaps represents a 24-h time series in a given month. Solid lines indicate the two largest change-points across months, dashed lines indicates the largest extremum across months between the maximum and the minimum, and other significant extrema are found at 1% level. The heatmaps of size 12 × 24 are smoothed using cubic interpolation with seven interpolated points between each sampled value. Contours indicate sunrise and sunset in local time in London, United Kingdom. Both sadness and anger show strong morning minima occurring at the same time in the weekends.

