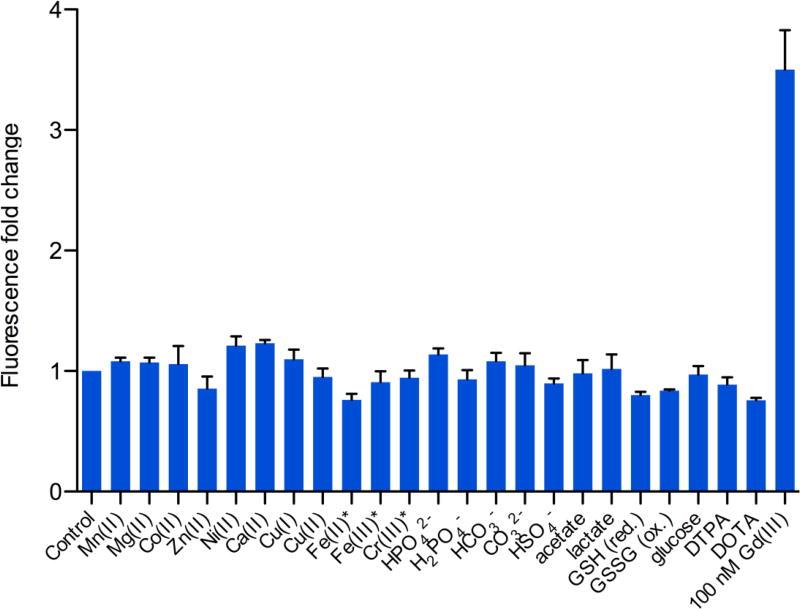
Fig. 5.
Fluorescence fold change of Ln-aptamer with different metal ions, anions, DTPA, DOTA and glucose. Fold change is calculated by normalizing the fluorescence reading to the control (Ln-aptamer-QS mixture in buffer). In all cases, the fluorescence unit readings range only from ~2000 – ~4000 a.u. No significant change is observed with any of the tested analytes. As a comparison, the change with 100 nM of aqueous Gd(III) is ~3.5 fold. Concentration of the analytes used: 400 µM of the metal ions, *: 50 µM for Fe(III), Cr(III) and Fe(II), 1 mM of all the anions, 5 mM of glucose, and 1 mM of DTPA and DOTA ligands. Data is plotted as average fold change ± standard deviation, n = 4 – 6

