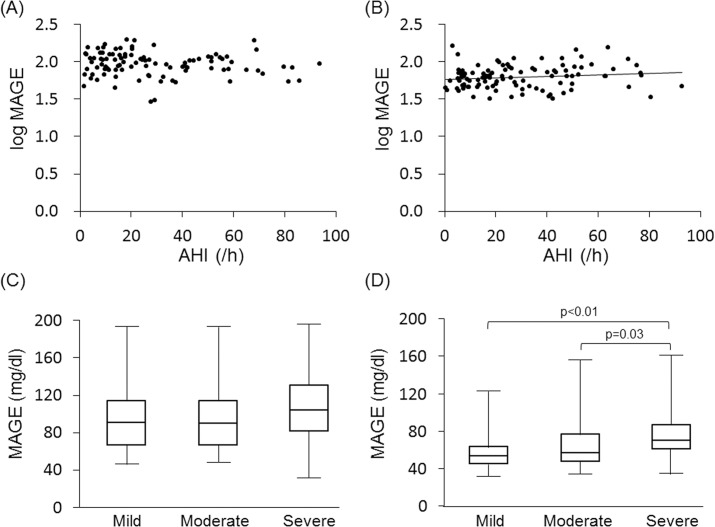
Fig 1. Relationship between severity of SDB and glucose variability: DM group vs. non-DM group.
Scatterplots of log MAGE against AHI in the DM group (A) and in the non-DM group (B). There was no correlation between AHI and log MAGE in the DM group, but there was a weak correlation in the non-DM group (y = 0.001x+1.8, r = 0.14, p<0.01). Comparisons of MAGE between subgroups with different severities of SDB in the DM group (C) and in the non-DM group (D). SDB was classified by its severity into mild SDB (5≤AHI<15), moderate SDB (15≤AHI<30) and severe SDB (AHI≥30). Level of MAGE in the severe SDB subgroup was significantly higher than that in the mild SDB subgroup in the non-DM group but not in the DM group. The ends of the closed box show the upper and lower quartiles, and the upper and lower whiskers represent data outside the middle 50%.

