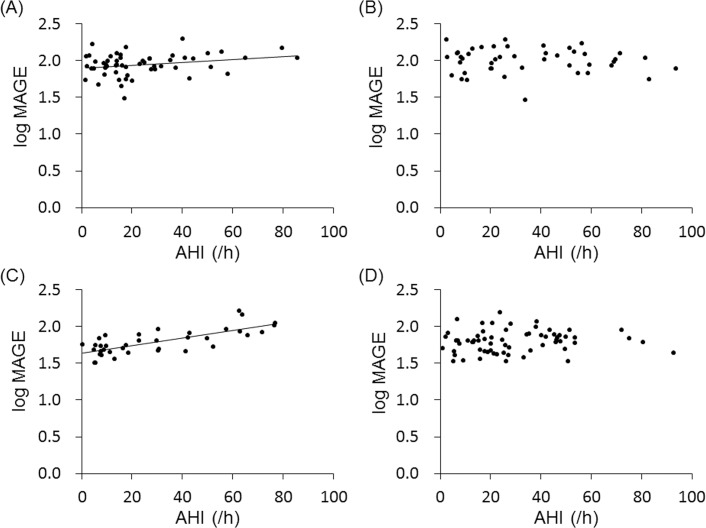
Fig 2. Relationship between severity of SDB and glucose variability in subgroups with different BNP levels.
Scatterplots of log MAGE against AHI in the DM low-BNP subgroup (A), DM high-BNP subgroup (B), non-DM low-BNP subgroup (C) and non-DM high-BNP subgroup (D). Significant correlations were observed in the DM low-BNP subgroup (y = 0.002x+1.9, r = 0.26, p<0.05) and non-DM low-BNP subgroup (y = 0.005x+1.6, r = 0.74, p<0.01).

