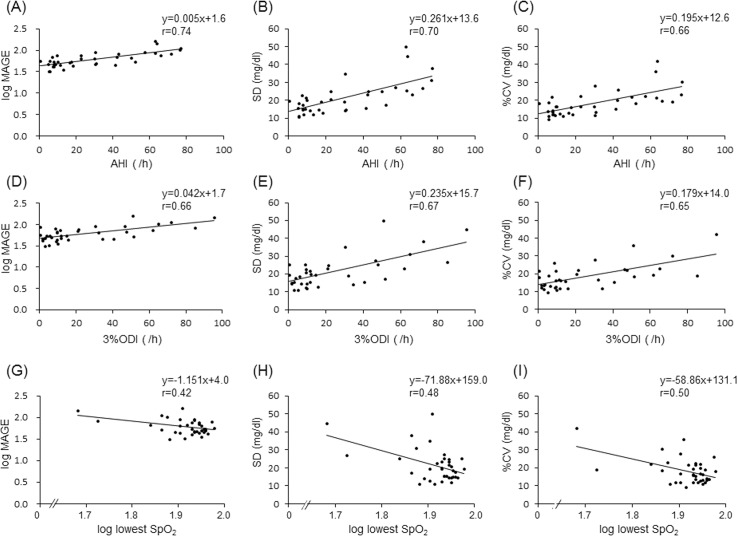
Fig 3. Relationships between severity of SDB and indices of glucose variability.
Log MAGE (A), SD (B) and %CV (C) in each patient were plotted against AHI (A, B, C), 3%ODI (D, E, F) and log lowest SpO2 (G, H, I) in the non-DM low-BNP group. Of these relationships, the correlation between AHI and log MAGE was strongest.

