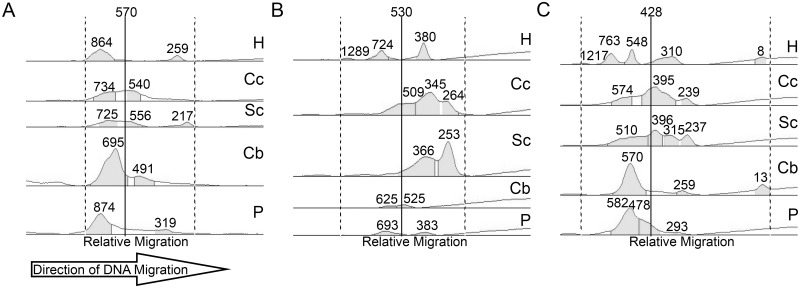
Fig 2. Quantitative analysis of expanded GAA repeat instability in the FXN gene across different tissues.
The expanded GAA repeats in the FXN gene were amplified from genomic DNA extracted from heart (H), cerebral cortex (Cc), spinal cord (Sc), cerebellar cortex (Cb) and pancreas (P) tissues isolated from FRDA patients. The band intensity of the PCR products and repeat size are shown for FRDA patients (A) F2, (B) F7, and (C) M6. Solid vertical lines represent the mean of all GAA repeat sizes detected across all five tissues for each patient. Gel lanes were manually outlined and gel bands were detected via the Image Lab 5.0’s band finder set to high sensitivity. Faint bands of PCR products not detected by the software were manually identified. Band boundaries, accounting for smearing, were automatically outlined by the program with final manual adjustments to include the entire spectrum of PCR products. Multiple PCR analyses with determinations of GAA lengths were performed to demonstrate reproducibility of PCR and reliability of measurements (S4 Fig).

