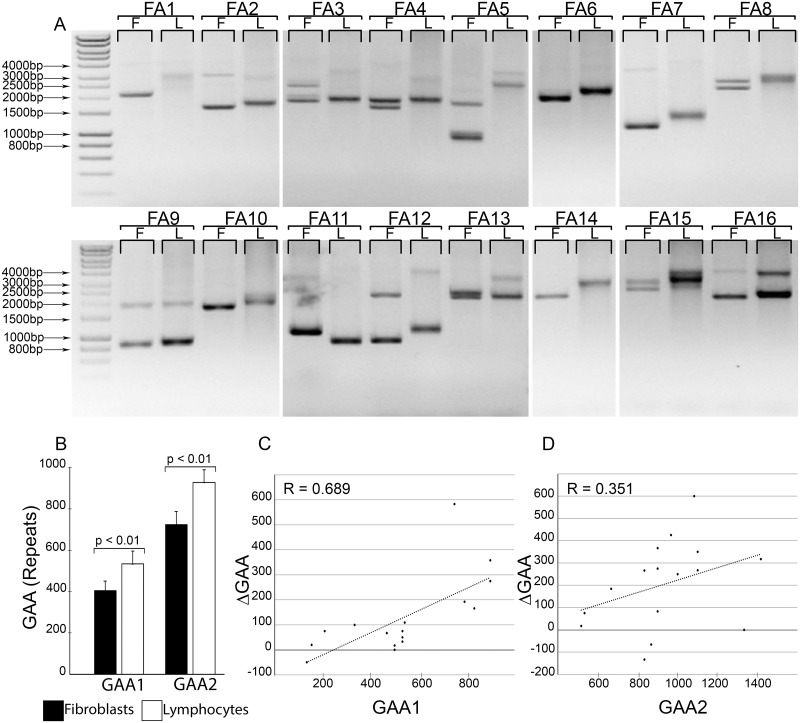
Fig 4. Determination of GAA repeat length in paired FRDA patient fibroblast (F) and lymphocyte (L) samples.
(A) Agarose gel analysis of GAA repeat sizes in fibroblast/lymphocyte samples isolated from the same individual (FRDA patients FA1—FA16). (B) The mean sizes of the GAA1 and GAA2 alleles between all fibroblast and lymphocyte samples (n = 16) were calculated and compared. A p-value <0.05 denotes a significantly significant difference. (C, D) Correlation between the number of GAA repeats expanded in lymphocytes relative to size of the repeat tracts in fibroblasts and the number of GAA repeats in lymphocytes. The difference between the expanded GAA repeat lengths observed in lymphocyte and fibroblast samples (ΔGAA) was plotted against lymphocyte GAA sizes for each of the 16 FRDA paired samples. The analysis was performed for both alleles (C) GAA1 and (D) GAA2. The Pearson’s correlation coefficient (R) is indicated.

