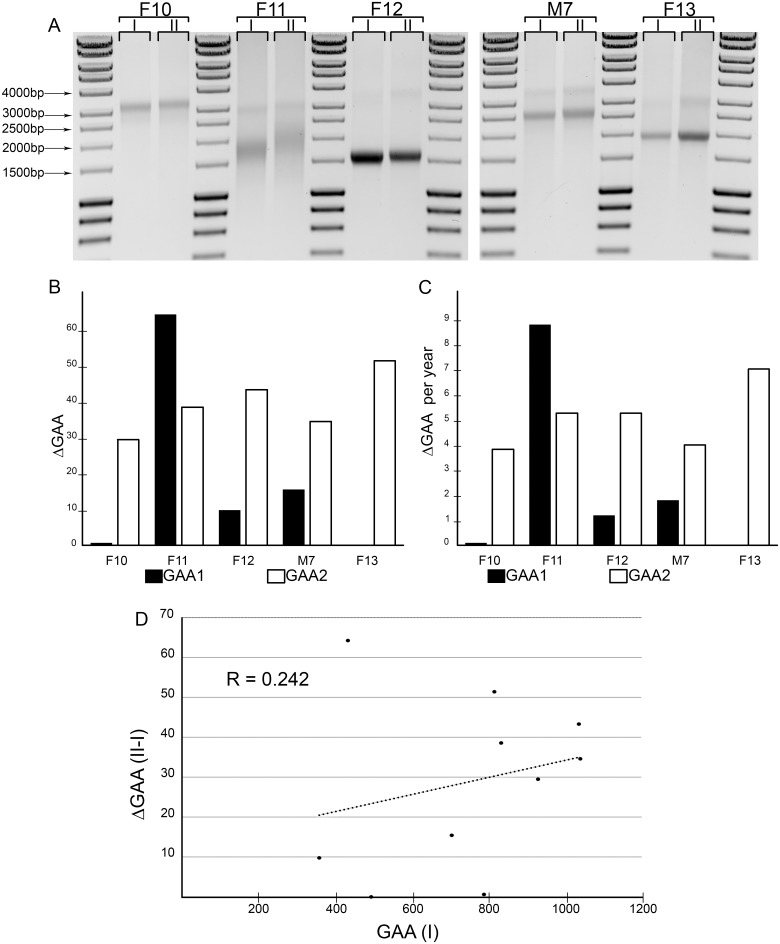
Fig 5. Assessing time-dependent changes of GAA tract length in FRDA lymphocytes.
(A) The GAA repeat tract at the FXN locus was amplified using genomic DNA extracted from lymphocytes, which were isolated from 5 patients (F10, F11, F12, M7 and F13). Blood samples were taken at an initial timepoint (I) and a second time point 7–9 years after the initial sampling (II) (Table 3). The time-dependent changes in GAA repeat length were quantitated as (B) total GAA repeat gain/loss (ΔGAA) and (C) rate of the change (ΔGAA per year). (D) The Pearson’s correlation coefficient was calculated using the size of the GAA tract at time point I [GAA(I)] and the change of the number of GAAs between time points II and I [ΔGAA (II-I)]. Five pairs of samples (n = 10 alleles) were analyzed.

