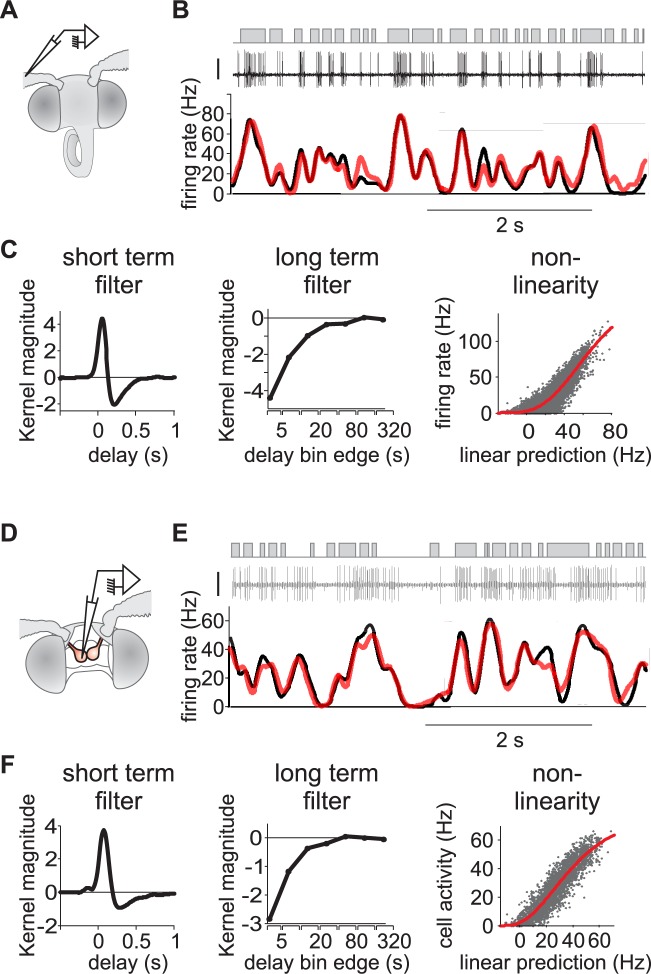
Fig 1. L-N model captures the responses of both ORNs and PNs to white-noise stimuli.
(A) Moth preparation for ORN recording. A tungsten electrode is inserted at the basis of a sensillum. (B) Response of an ORN to white-noise odor stimuli (correlation time 50 ms). Top: stimulus sequence (puffs in grey). Middle: action potential recordings (vertical bar 1 mV). Bottom: firing rate dynamic calculated with a Gaussian kernel (black) and predicted with an L-N model (red). For this ORN, the coefficient of determination between model and recorded firing rates is R2 = 0.81. (C) L-N model fitted to the response of the same neuron as in (B) to 15 min of white-noise stimuli. Left to right: short term linear filter, long term linear filter calculated on a log time scale, static nonlinearity (grey dots: measured vs predicted values, red line: fitted Hill function). (D) Moth preparation for PN recording. A glass electrode is inserted in the cumulus of an antennal lobe. (E-F) Same as (B-C) but on a PN. White-noise correlation time is 50 ms and R2 = 0.84.

