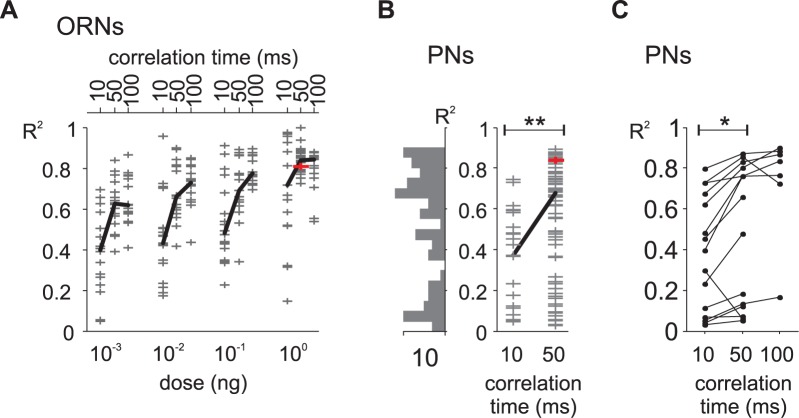
Fig 3. Performances of L-N model predictions.
(A) Distribution of coefficient of determination R2 between model prediction and ORN responses to white-noise stimuli. Grey crosses: individual cells. The example ORN from Fig 1B and 1C is shown with a red symbol. Black segment: median values. R2 depends both on noise correlation time (ANOVA, p<10−10) and pheromone load (ANOVA, p<10-10). (B) Distribution of R2 between model prediction and PN responses to noise stimuli, independent samples, n = 97 cells. Left: the distribution histogram shows the heterogeneity of R2 values. **: p<0.01 Wilcoxon’s rank sum test. The example PN from Fig 1D and 1E is shown with a red symbol. (C) R2 between model prediction and PN responses to noise stimuli, paired samples. For this data set (n = 15 cells), two or three noise sequences with different correlation times were tested for each cell. Line segments join the R2 calculated for the same cell. *: p<0.05 Wilcoxon’s signed rank test. The values in response to the 50 ms correlation time are included in (B).

