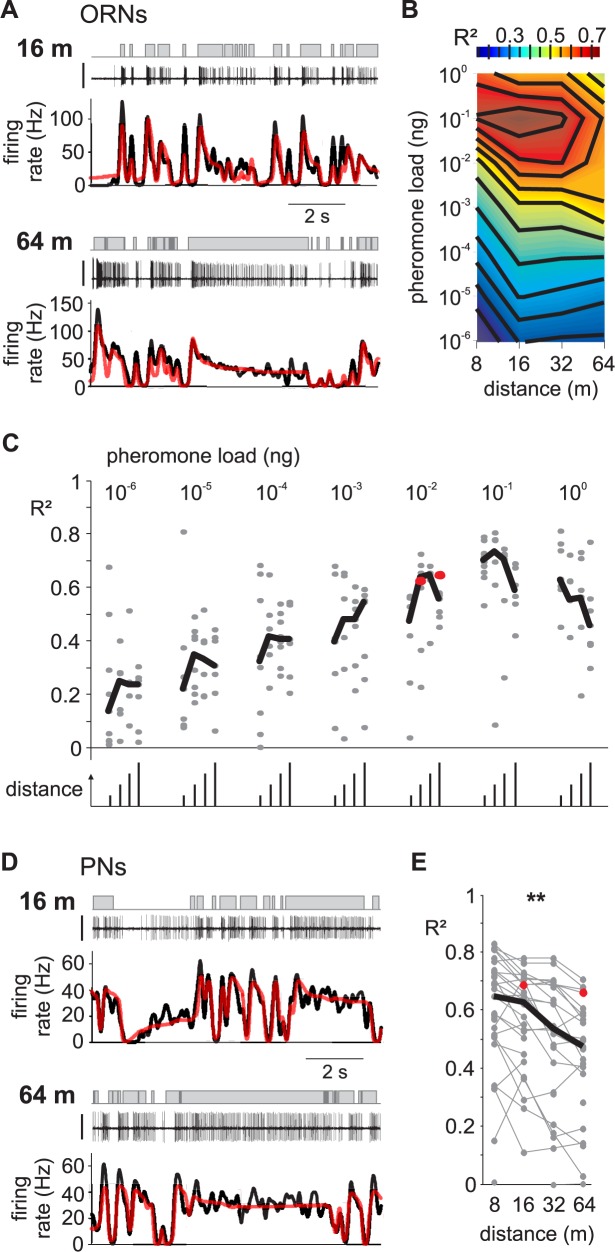
Fig 7. L-N model performance varies with the simulated distance during turbulent stimuli.
(A) Response of two ORNs to turbulent stimuli simulating distances of 16 m (top, R2 = 0.63) and 64 m (bottom, R2 = 0.65). Same conventions as in Fig 1B. (B) Heatmap of the median coefficient of determination (R2) between L-N model prediction and measured ORN responses, plotted as a function of pheromone load and distance. Note that at high pheromone load, R2 is higher for short distances, but this is not true anymore for low pheromone loads. (C) Cell distribution of R2 between L-N prediction and measured ORN responses. Grey dots are R2 for individual cells, black segments show the median values. For each pheromone load value, the distance of the odorant source is 8, 16, 32 and 64 m from left to right. (D) Response of a PN to turbulent stimuli simulating distances of 16 m (top, R2 = 0.69) and 64 m (bottom, R2 = 0.66). Same conventions as in Fig 1B. (E) R2 between L-N prediction and measured PN response decreases with distance. One cell is represented by up to 4 dots joined by a grey line. Black line, median value. The example PNs from (D) are shown with red symbols. R2 decreased linearly with the log of the distance (**: p<0.01, permutation test applied on linear regression ramp).

