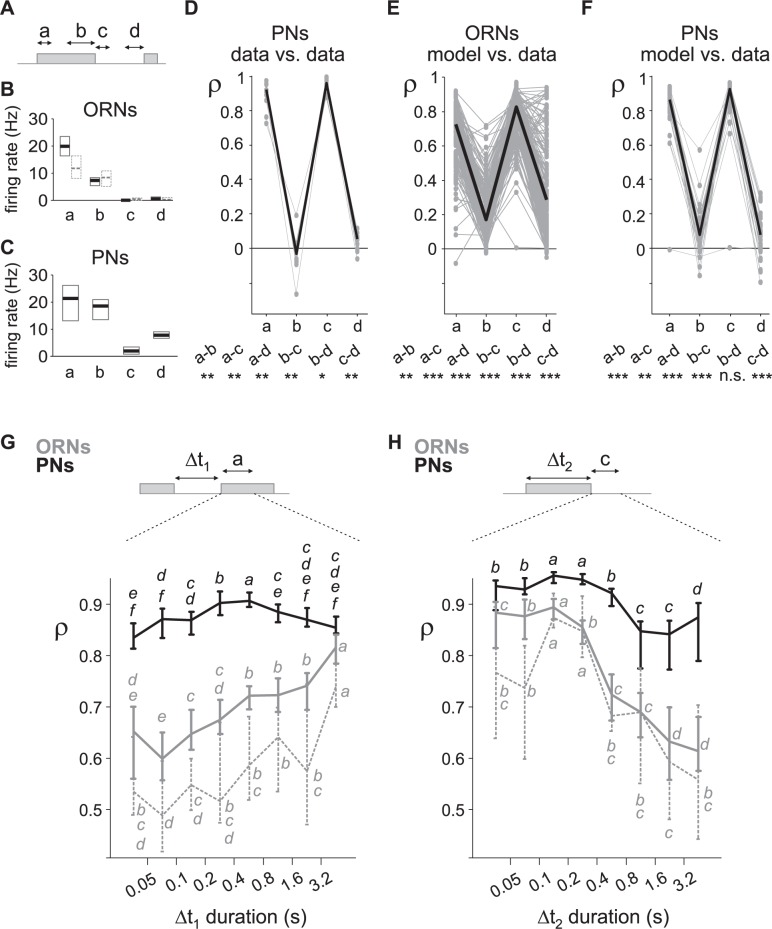
Fig 8. Neuronal coding varies with time sub-regions during turbulent stimuli.
(A) Four different sub-regions of stimulus sequences were defined with (a) onset of puffs, (b) end of long puffs, (c) offset of puffs and (d) end of long blanks; see text for detailed definition. (B) (ORNs and in dotted grey the subpopulation of ORNs stimulated with pheromone loads of 10-5 and 10−4 ng) and (C) (PNs): median values and bootstrap confidence intervals (95%) of firing rate in the 4 sub-regions. (D) Correlation coefficient between consecutive responses of PNs to a sequence turbulent stimuli for the 4 sub-regions defined in (A). Distance was 16 m. Cell number = 13. For each cell, 4 grey dots joined by a grey line represent the median values of correlation coefficients θ during sub-regions. Black line joins the median values. Bottom: dual tests between sub-regions (*: p<0.05, **: p<0.01, ***: p<0.001, n.s.: non-significant, Wilcoxon’s signed rank tests). (E) Correlation coefficient between L-N prediction and ORN responses for the 4 sub-regions. Responses to all distances and doses are pulled together. Same conventions as in (D). (F) Correlation coefficient between L-N prediction and PN responses for the 4 sub-regions. Same conventions as in (D). (G) Correlation coefficient between L-N prediction and measured responses during the onset of puffs depends on the time delay from the end of the preceding puff. Plot shows median values and bootstrap confidence intervals. Grey: ORNs, dotted grey: subpopulation of ORNs stimulated with pheromone loads of 10−5 and 10−4 ng, black: PNs. Both for ORNs and for PNs, values with the same letters are not statistically different within a set of neurons (Wilcoxon’s signed rank test, p>0.05). (H) Correlation coefficient at the end of puffs depends on the duration of the preceding puff. Same convention as in (G).

