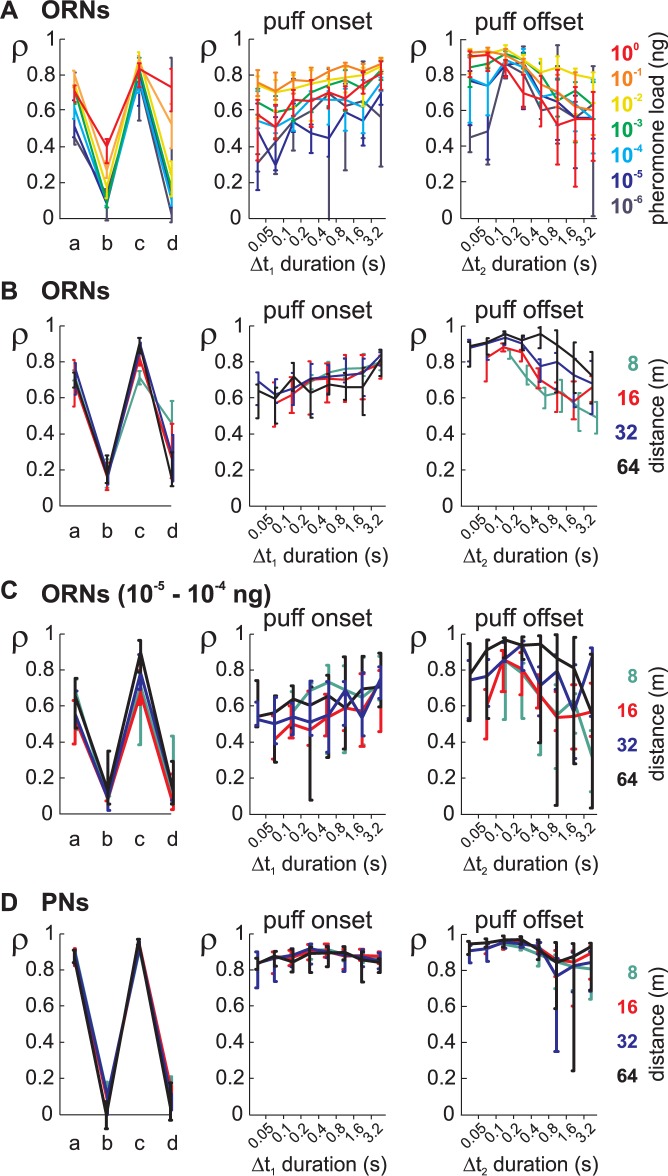
Fig 9. Neuronal coding of time sub-regions of turbulent stimuli analyzed as a function of pheromone load and distance.
(A) Analysis of olfactory coding in ORNs as a function of pheromone load. Left: coding during the 4 sub-regions described in Fig 8A analyzed for each pheromone load using the same analysis as in Fig 8E. Plot shows median values of correlation coefficients and bootstrap confidence interval. Colors code for pheromone load. Middle and right: same analysis as in Fig 8G and 8H, but ORN data are subdivided in different pheromone loads. Middle: coding of onset of puffs depends on time delay from the end of the preceding puff and on pheromone load. Right: coding of offset of puffs depends on time delay from the end of the preceding puff and on pheromone load. (B) Sub-region analysis of olfactory coding in ORNs as a function of distance. Same conventions as in (A), but ORN data are subdivided in different simulated distances. (C) Same analysis as in (B) but from the subpopulation of ORNs stimulated with pheromone loads of 10−5 and 10−4 ng. (D) Sub-region analysis of olfactory coding in PNs as a function of distance. Same conventions as in (A), but PN data are subdivided in different distances.

