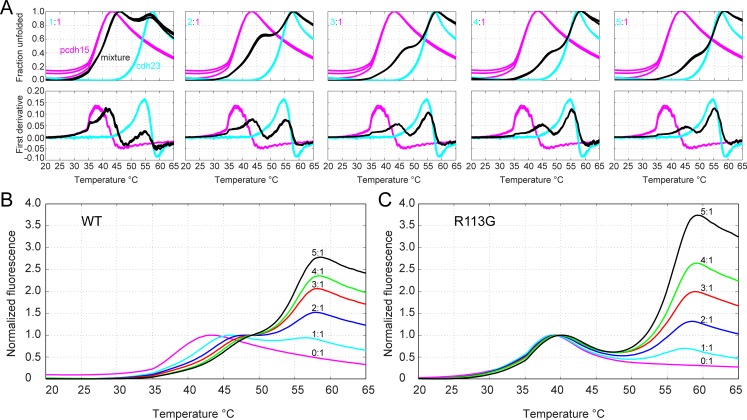
Fig 3. Thermal melting curves of cdh23 and pcdh15 variants monitored with SYPRO orange.
(A) Upper panels show normalized fluorescence for melting curves with cdh23(WT) in cyan, pcdh15(WT) in magenta, and the mixture in black. Lower panels show the derivative of the normalized melting curve. Concentration ratios from left to right are: 1:1, 2:1, 3:1, 4:1, 5:1 (cdh23:pcdh15). (B-C) Overlay of the melting curves for pcdh15(WT) (B) and for pcdh15(R113G) (C) at indicated cdh23:pcdh15 ratios. The curves were normalized to pcdh15 only (first peak).

