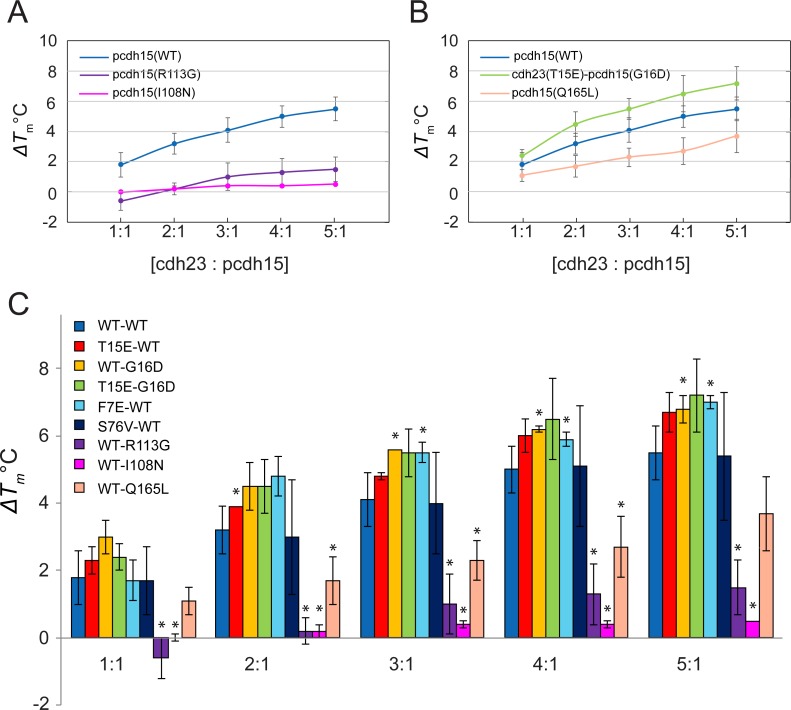
Fig 4. Variation of ΔTm at increasing ratios of cdh23 and pcdh15.
(A) Variation of ΔTm for WT and two deafness-related complexes at increasing concentration ratios. The WT ΔTm increases from ~2 to ~5.5°C from 1:1 to 5:1 ratios. The deafness mutants have ΔTm < ~1°C at all ratios. (B) ΔTm variation of the most stabilizing mutant G16D-T15E (green), the WT complex (blue), and the less stabilizing mutant Q165L (pink). The double mutant has higher ΔTm than the WT complex at all ratios. (C) Bar graph of ΔTm variation of selected mutants at different cdh23:pcdh15 ratios. Asterisks indicate statistically significant differences with WT complex (p ≤ 0.05). Data for all mutants including pcdh15- A20V, D160W, L187W, Q165L, S92V and cdh23-T190W are shown in Table 1.

