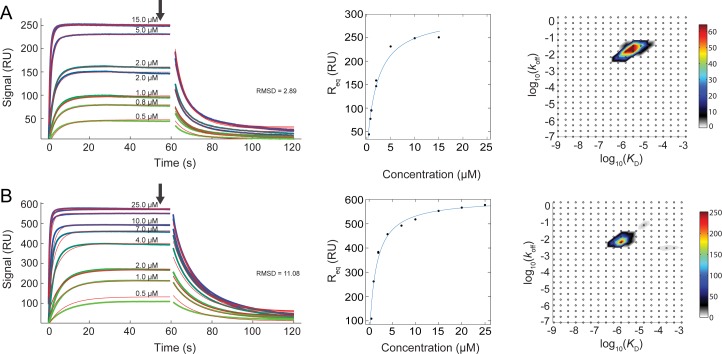
Fig 5. Quantitative SPR measurements of cdh23 molecules binding to pcdh15.
(A) Left, association and dissociation of the cdh23(WT)-pcdh15(WT) complex. Experimental data (sensorgrams) are represented in a gradient of green to blue colors for different concentrations of cdh23(WT) as labeled. Red lines indicate fitted model parameters (RMSD = 2.89). Injection peaks were removed and not fitted. Top three traces correspond to 5, 10, and 15 μM, respectively, but the 10 μM trace is not labeled for clarity. Black arrow indicates the position of equilibrium SPR signal (Req). Middle panel shows the fitting of Req to a Langmuir binding isotherm at different concentrations of analyte. Measurements for selected concentrations were done in duplicates. Right panel shows a heat map of the koff and KD distribution from the global fit of all traces in corresponding leftmost panel. The signal density of the peaks in the koff and KD distribution plot can directly be discerned from their color, which is scaled according to the color bar on the right side of the distribution plot [48]. (B) Association and dissociation curves for the T15E-G16D complex shown as in (A) (RMSD = 11.08). Top three traces correspond to 15, 20, and 25 μM, respectively, but the 15 and 20 μM traces are not labeled for clarity. The data were analyzed with the EVILFIT algorithm and the Biacore evaluation software.

