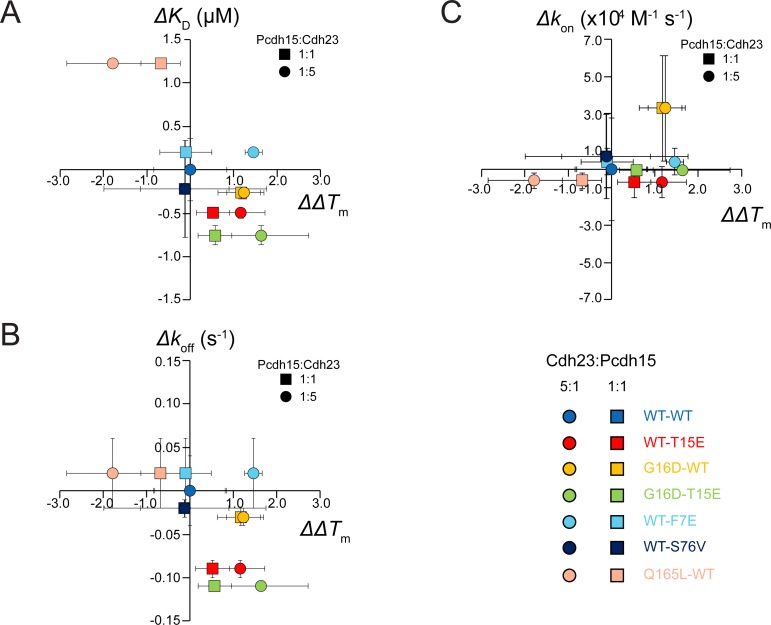
Fig 6. Rate and equilibrium constants for different mutants vs ΔΔTm.
(A-C) KD vs ΔΔTm (A), koff vs ΔΔTm (B), and kon vs ΔΔTm (C) for various cdh23-pcdh15 complexes (WT-WT: light blue; T15E-WT: red; WT-G16D: yellow; T15E-G16D: light green, F7E-WT: cyan; S76V-WT: navy blue; WT-Q165L: pink). Squares and circles represent data points for ΔΔTm at 1:1 and 5:1 ratios, respectively. The WT-WT complex lies at the origin. Data points along the dashed diagonal line in A support ΔΔTm as a good predictor of KD, while data points off the diagonal indicate exceptions (most notably F7E-WT). Vertical error bars represent standard deviation for measurements of the rate or equilibrium constant of that mutant. Horizontal error bars represent the standard deviation for the ΔTm measurement.

