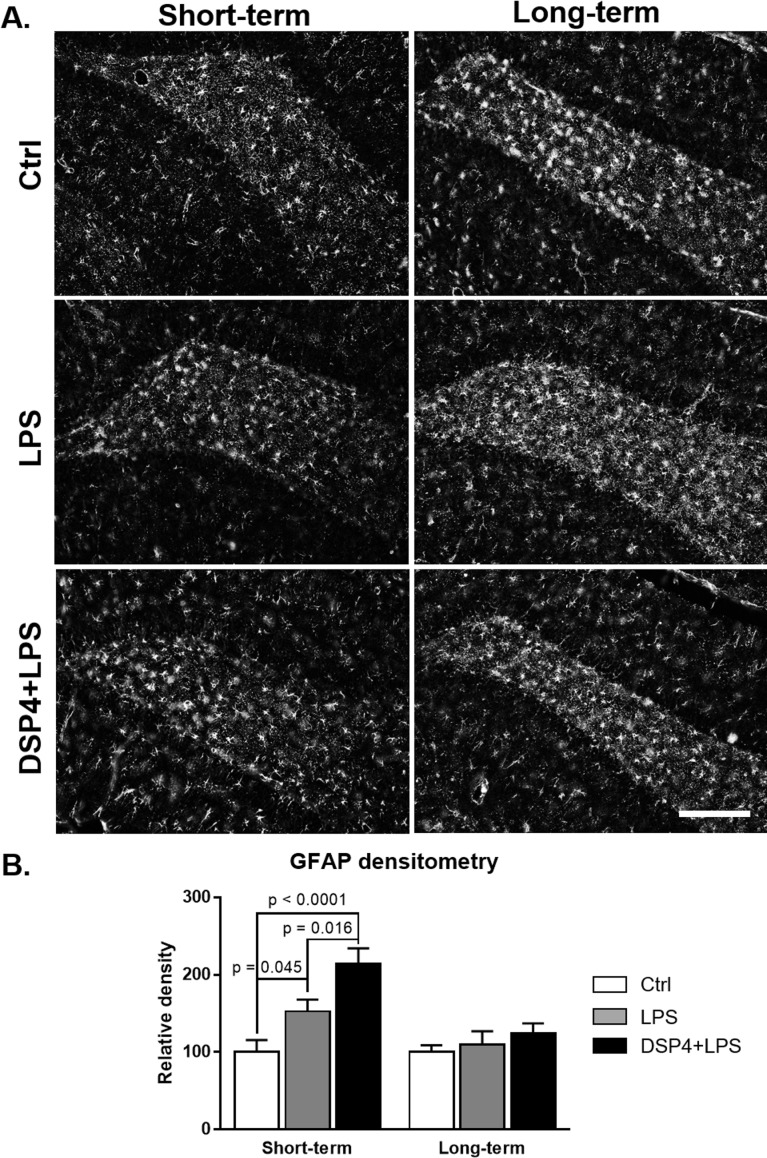
Fig 2. Hippocampal GFAP immunofluorescence.
GFAP-immunofluorescent staining in the hippocampal dentate gyrus (A) and densitometry (B; expressed as percent of the Ctrl group) in the short-term and long-term subgroups. The histograms demonstrate a significant increase in GFAP-positive astroglia in the DSP4+LPS-treated rats in the short-term subgroup but not in the long-term subgroup. Densitometry confirmed observed changes with a highly significant increase in GFAP density in the DSP4+LPS group compared to Ctrl and LPS groups in the short-term subgroup. No significant differences were found between treatment groups in the long-term subgroup. Scale bar represents 250 μm.

