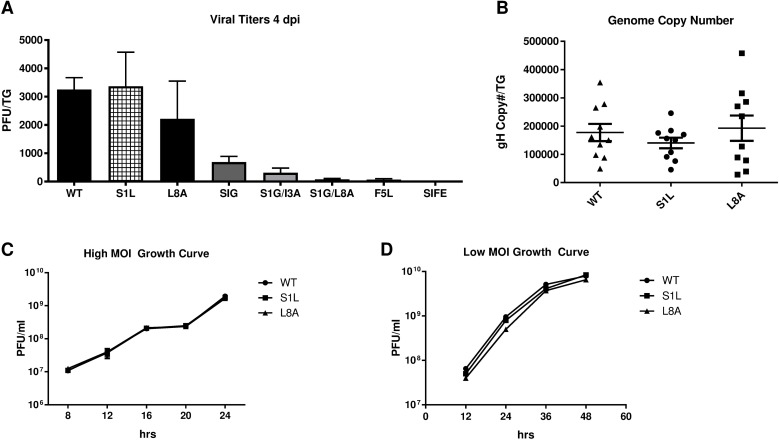
Fig 3. Growth of HSV gB mutants in vitro and in vivo.
(A) Virus growth in the TG of B6 mice was determined at 4 days post ocular infection with 1x10⁵ PFU of either HSV-1 WT or HSV-1 containing the gB498-505 epitope mutants detailed in Table 1. TG were harvested and subjected to three freeze thaw cycles and infectious virus released into the supernatant was titrated on Vero cells. The graph represents the mean virus titer for each virus ± SEM of the mean (n = 5 mice). This is a representative of two separate studies with similar results. (B) Genome copy number determined by qPCR in the TG of mice infected with HSV-1 WT, S1L, or L8A following harvest at day 8 post ocular infection (n = 10). Values are representative of the total copies per TG. (C,D) Monolayer cultures of Vero cells were infected at a multiplicity of infection (MOI) of 10 PFU/cell (high MOI Growth Curve) or 0.01 PFU/cell (Low MOI Growth Curve) respectively with HSV-1 WT, S1L, or L8A. At the indicated hours post-infection, cells and supernatants were pooled, subjected to three freeze–thaw cycles and the viral titers were determined by plaque assay. The mean PFU/culture ± standard error of the means (SEM) is shown at each time.

