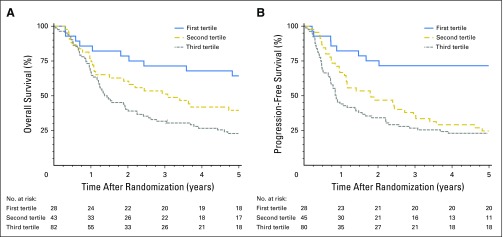
Fig 3.
Survival curves for validation cohort. (A) Overall survival (OS) curves for the validation cohort for the three groups defined by tertiles of the total points from the derivation cohort (P values: first tertile versus second tertile, .05; second tertile versus third tertile, .04). (B) Progression-free survival curves for the validation cohort for the three groups defined by tertiles of the total points from the derivation cohort (P values: first tertile versus second tertile, < .001; second tertile versus third tertile, .3).

