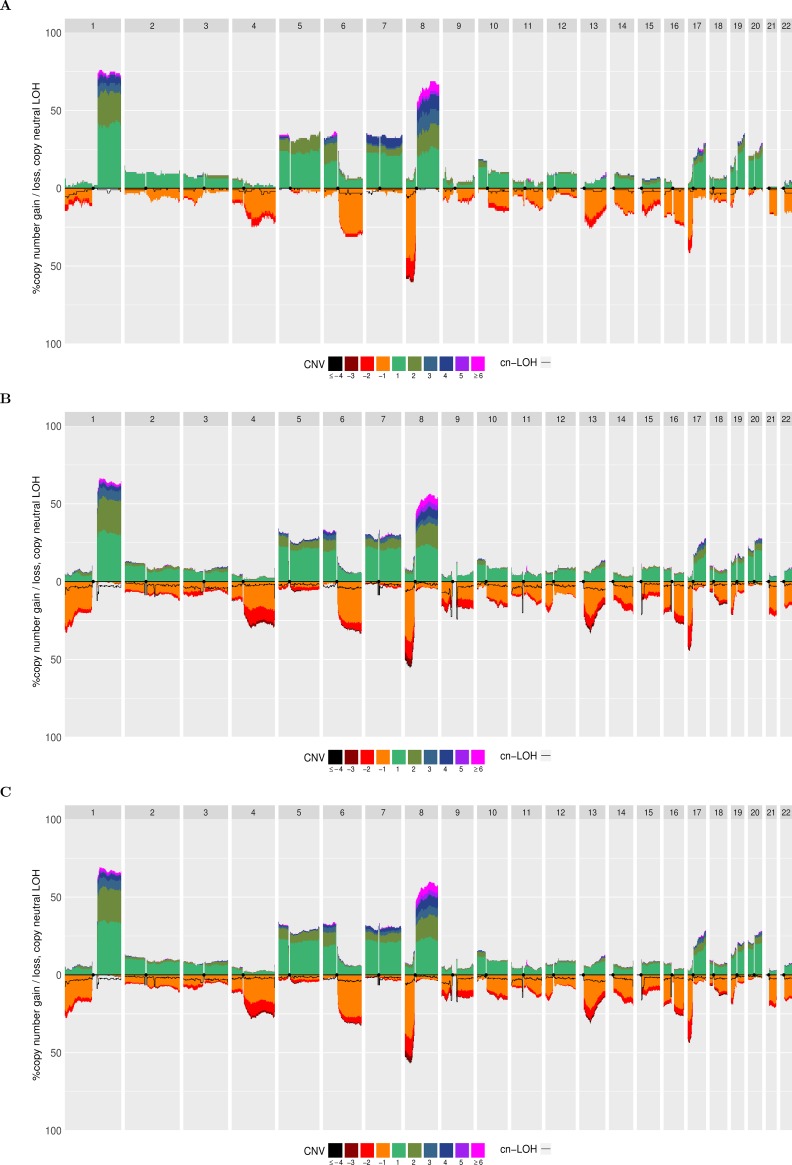
Fig 2. Quantitative stacked histograms produced by aCNViewer showing the frequency of CNVs and cn-LOH along the genome in HCCs.
Quantitative stacked histograms generated using A) 96 freely available HCC Affymetrix 500K Human Mapping Array data [1], B) 243 HCC WES experiments from [2] and C) 317 pooled HCCs from both SNP and WES experiment data.

