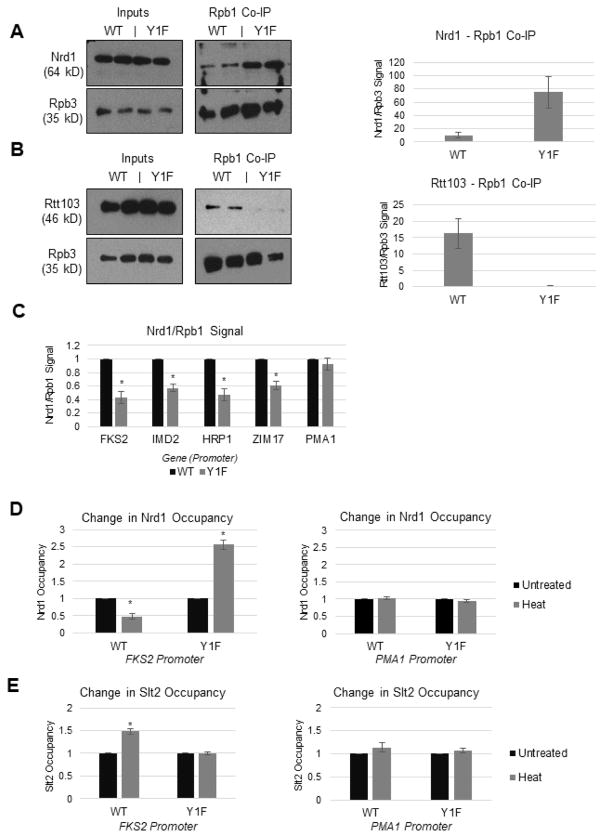
Figure 6. RNAP II Tyr1 and Slt2 affect Nrd1 recruitment to RNAP II and chromatin.
(A) Western blot analysis of Nrd1 levels after Rpb1 co-IP (using y-80 antibody), with quantification. Nrd1 interaction with RNAP II quantified using Rpb3. (B) Western blot analysis of Rtt103 levels after Rpb1 co-IP (using y-80 antibody), with quantification. Rtt103 interaction with RNAP II quantified using Rpb3. (C) ChIP analysis of Nrd1 occupancy at promoter regions of indicated genes in WT and Y1F strains. (D) ChIP analysis of Nrd1 occupancy at promoter and body regions of model gene FKS2, before and after heat stress. (E) ChIP analysis of Slt2 occupancy at promoter and body regions of model gene FKS2, before and after heat stress. All data are represented as mean +/− SE of three independent experiments.

