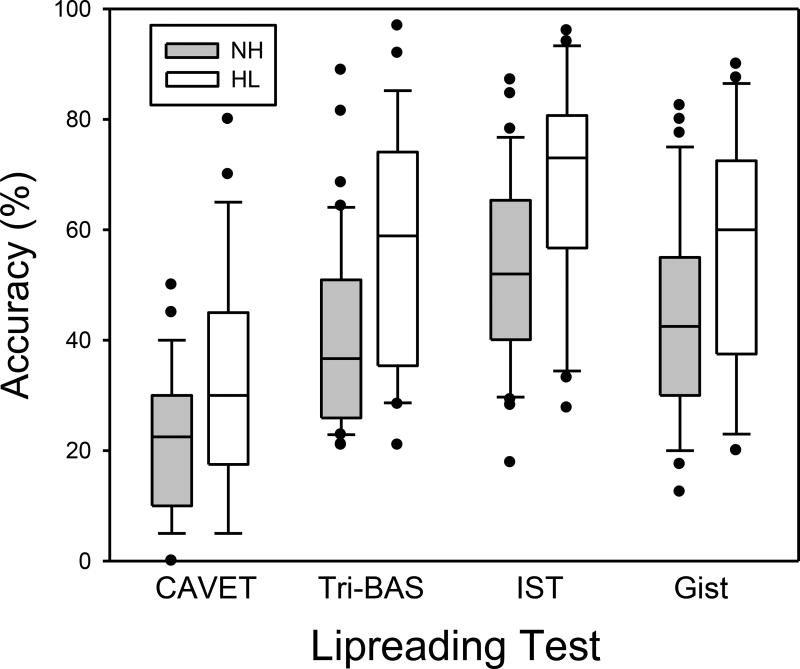
Figure 5.
Box plots depictingthe distributions of scores on the four lipreading measures for the NH and HL groups. Horizontal lines within the rectangles represent median scores, and the top and bottoms of the rectangles correspond to the first and second quartiles; the horizontal lines at the ends of the vertical “whiskers” represent tenth and ninetieth percentile scores, and the solid circles represent scores outside this range.

