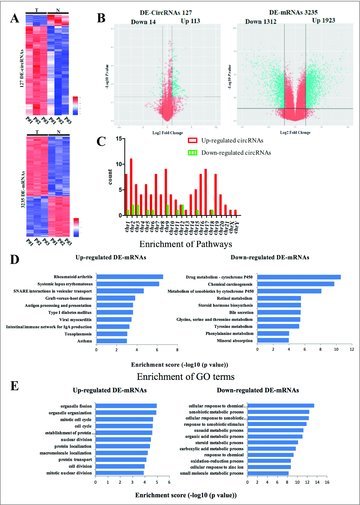
Figure 1.

Differentially expressed circRNAs and mRNAs in 3 pairs of liver cancer patient tissues. (A) Heat maps of aberrantly expressed circRNAs and mRNAs. A total of 127 circRNAs and 3235 mRNAs showed significantly aberrant expression (≥ 2-fold change); P < 0.05 and FDR < 0.05. Each column represents one sample, and each row indicates a transcript. T: tumor tissues. N: normal tissues. (B) Volcano plots of aberrantly expressed circRNAs and mRNAs. The vertical green lines correspond to 2-fold upregulation and downregulation, respectively; the horizontal green line indicates a P-value of 0.05. The red points in the plots represent the significantly differentially expressed genes(C) Enrichment analysis of pathways term for DE-mRNAs. Pathway analysis was predominantly based on the KEGG database. The vertical axis represents the pathway category and the horizontal axis represents the -log10 (p value) of these significant pathways. (D) Enrichment analysis of GO term for DE-mRNAs. The vertical axis represents the biologic procession (BP) term and the horizontal axis represents the -log10 (p value) of these significant GO-BP term. (E) The distribution of differentially expressed circRNAs in human chromosomes.
