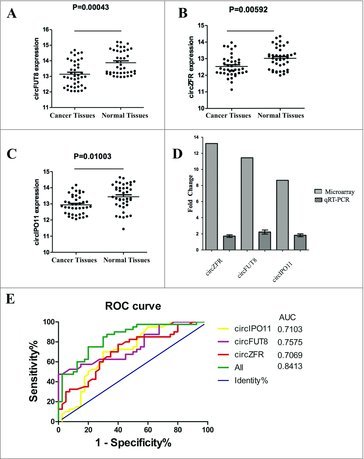
Figure 3.

Validation for the expression of significant transcripts by quantitative RT-PCR and ROC analysis of the circRNAs. (A) The expression levels of circZFR are significantly higher than those in corresponding nontumorous tissues. P < 0.001. (B) The expression levels of circFUT8 are significantly higher than those in corresponding nontumorous tissues. P < 0.01. (C) The expression levels of circIPO11 are significantly higher than those in corresponding nontumorous tissues. P < 0.05. (D) The fold change of the circZFR, circFUT8 and circIPO11 expression levels by microarray and qRT-PCR. (E) ROC curve analysis of circZFR, circFUT8 and circIPO11 for discriminative ability between liver cancer cases and normal controls.
