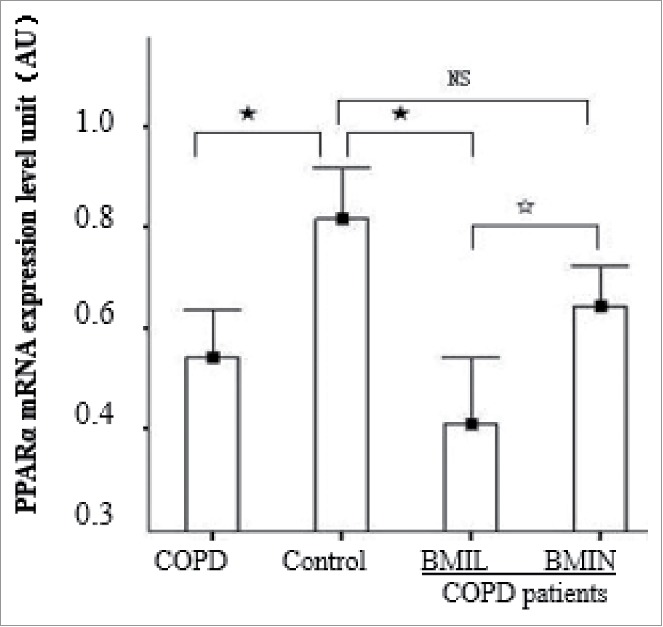
Figure 1.

PPARα mRNA expression levels in each group. Control, control group; BMIN, COPD patients with normal body mass index; and BMIL, COPD patients with low body mass index. Longitudinal coordinates were PPARα/GAPDH mRNA; AU = arbitrary units. F: P < 0.05; ★: P < 0.01; NS: not statistically significant.
