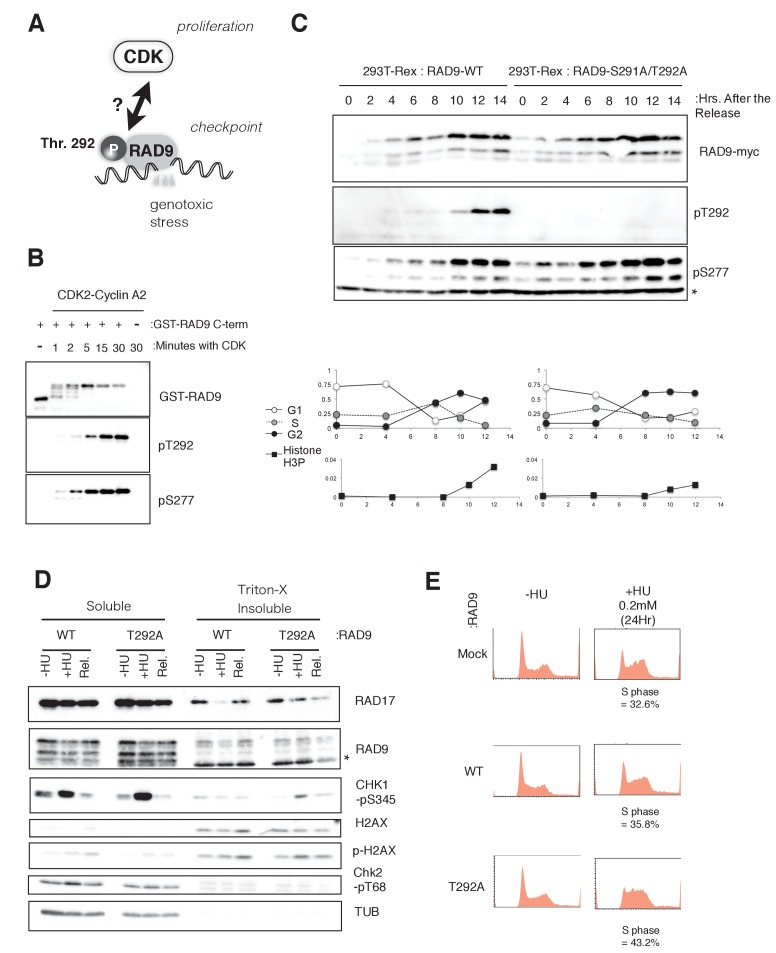
Figure 1. CDK phosphorylates threonine 292 of RAD9.
(A) Schematic of the aim of this manuscript. (B) The recombinant GST-tagged C-terminal (a.a. 266–391) portion of RAD9 was mixed with the purified active CDK2-CyclinA2 complex. Western blotting was performed using the α-RAD9 antibody and the α-pT292 (pT292) and α-phospho-Ser277 (pS277) RAD9 antibodies. (C) Top: The thymidine block and release experiment was performed on HEK293A-T-REx cell lines stably expressing RAD9-WT-mH or RAD9-S291A/T292A-mH. Doxycyclin (0.5 µg/ml) was added during the second thymidine block. The western blotting analysis of cell lysates obtained at the indicated time points is shown, and α-myc, α-pT292 and α-pS277 antibodies were used. The asterisk (*) shows a nonspecific signal. Bottom: The cell cycle profiles were quantified by a flow cytometer analysis. The G1, S, and G2 phases were quantified via propidium iodide staining, and the M phase cells were quantified using an antibody against the phospho-serine 10 of histone H3. (D) A chromatin fractionation assay (Ohashi et al., 2014; Zou et al., 2002) was performed in HEK293A-T-REx cell lines stably expressing RAD9-WT-mH (WT) or RAD9-S291A/T292A-mH (T292A). Cells were grown in media containing 1.5 mM hydroxyurea for 16 hr (+HU) and then released from the hydroxyurea arrest for 1 hr (Rel.). A western blotting analysis is shown, and α-RAD17, α-myc (RAD9), α-phospho-serine 345 of CHK1 (CHK1-pS345), α-phospho-serine 139 of Histone H2AX (p-H2AX), α-H2AX, α-phospho-threonine 68 of CHK2 (CHK2-pT68), and α-tubulin were used. (E) The flow cytometry analysis was performed with U2OS T-REx cells stably expressing RAD9-WT-mH (WT) or RAD9-S291A/T292A-mH (T292A), and the host U2OS T-REx cells (Mock). The cells were grown in media containing 0.2 mM hydroxyurea for 24 hr. The populations of cells showing the S phase peaks were quantified and indicated below the flow cytometer profiles. See also Figure 1—figure supplement 1. CDK phosphorylates threonine 292, and construction of RAD9-WT or -S291A/T292A(T292A) expressing stable cell lines.
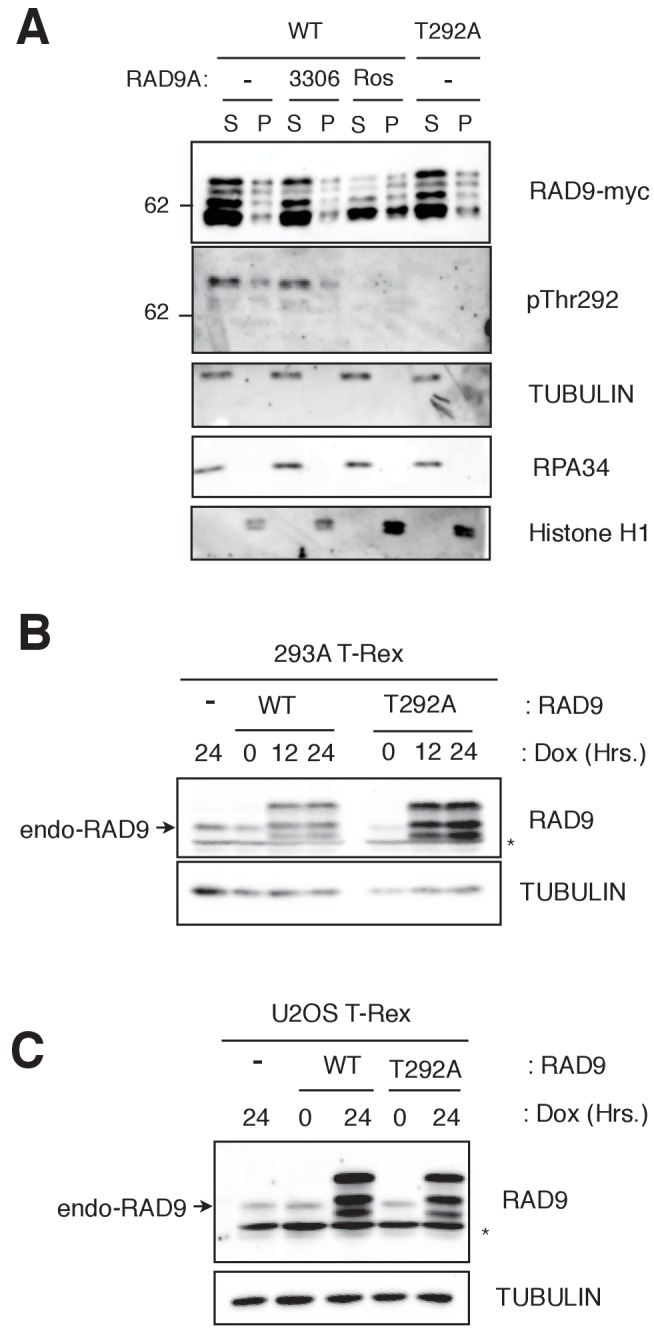
Figure 1—figure supplement 1. CDK phosphorylates threonine 292, and construction of the RAD9-WT and -S291A/T292A(T292A) expressing stable cell lines.


