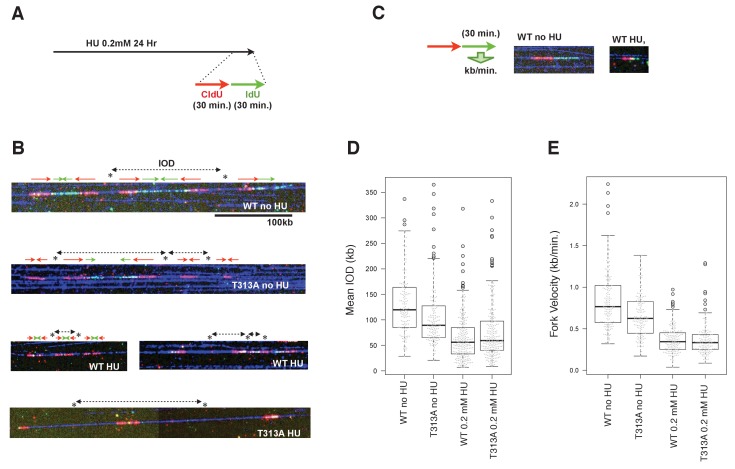
Figure 5. The effect of origin firing and DNA replication fork integrity of PLK1-dependent phosphorylation on RAD9.
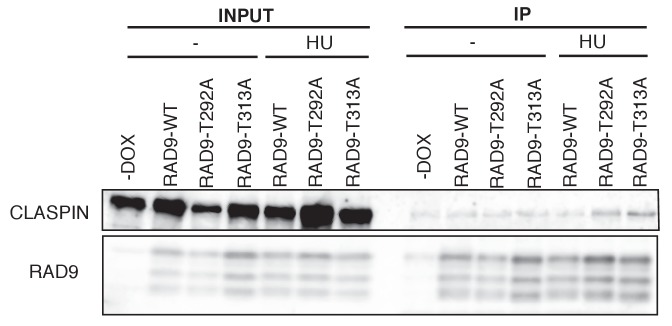
(A) A schematic of the time course applied for the combing assay analysis. U2OS cells expressing WT- or T313A-RAD9 from genomic FRT sites were used for the analysis. (B) Examples of DNA fibers seen in the DNA combing assay. The vertical strips seen were either the boundary of the assembled photo frames or noise produced upon scanning of DNA fibers. See the supplement for the surrounding regions (Supplementary file 3). (C) A schematic of the measurement of replication fork velocity. A green signal (IdU labeled DNA) was measured on a unidirectionally moving fork that is associated with a red signal (CldU labeled DNA). (D), (E) Mean Inter Origin Distance (IOD) values were measured and plotted on the graph in (D) (WT no HU: n = 140, T313A no HU: n = 146, WT 0.2 mM HU: n = 231, T313A 0.2 mM HU: n = 229). The velocity of each DNA replication fork was measured and plotted in (E). Boxplots overlaid with beeswarm plots are shown. Boxes indicate the upper and lower quartiles, and the central bar indicates the median value of the measurements. The graphs were made with the R program. The p-values in the IOD analysis were 8 × 10⁻⁸ (without HU) and 0.058 (with HU) (WT vs. T313A; the measurement values that were statistically significant (within the top and bottom whisker bars) were applied to calculate the p-values). The p-value in the replication fork velocity analysis was 5.8 × 10⁻⁷ (WT vs. T313A, without HU). See also Figure 5—figure supplement 1. The DNA combing assay in aphidicolin-treated cells, Figure 5—figure supplement 2. Enhanced RAD9-CLASPIN complex formation when CDK or PLK1 failed to phosphorylate RAD9.
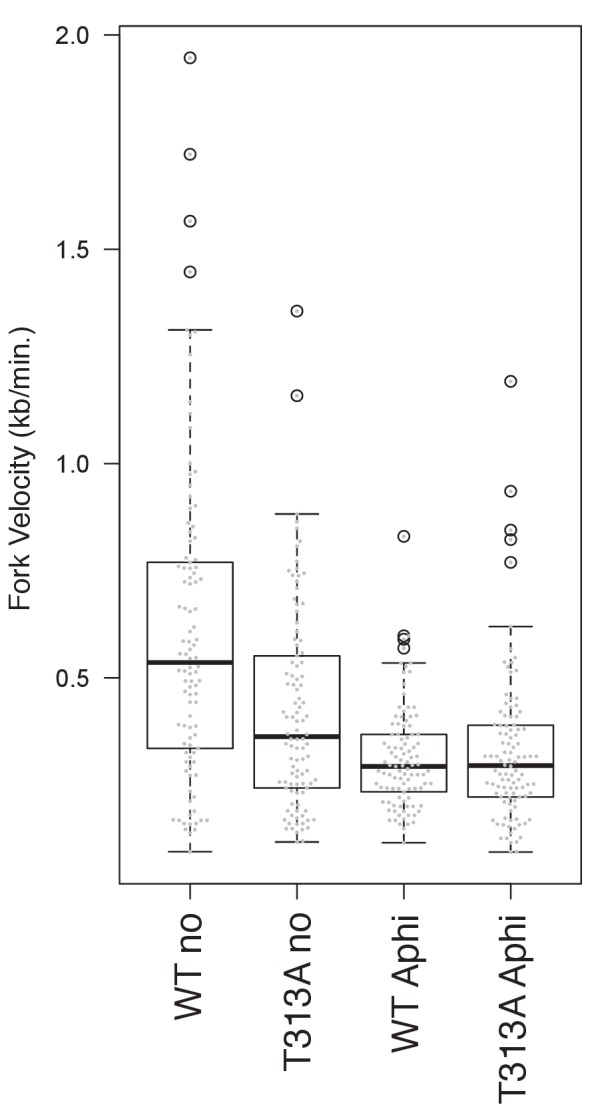
Figure 5—figure supplement 1. The DNA combing assay in aphidicolin-treated cells.


