Figure 11.

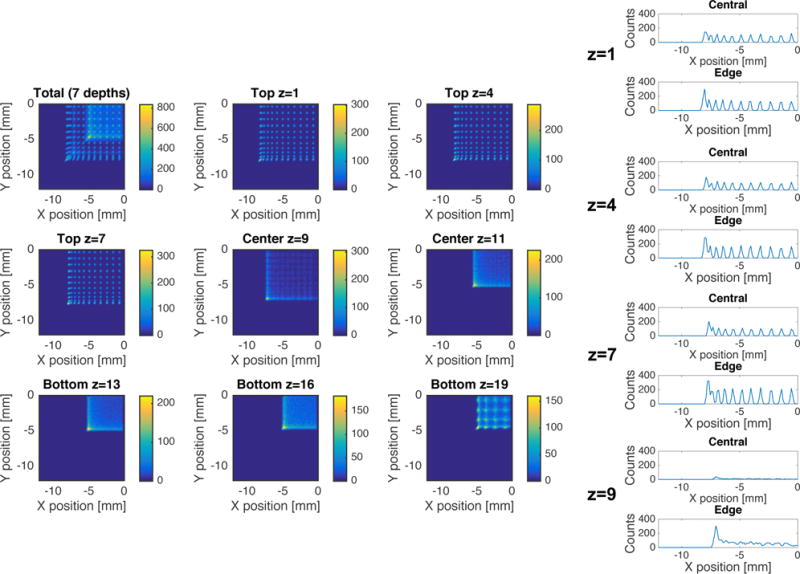
Flood maps and line profiles for each individual interaction depth for a detector with barriers half way through the detector, barrier RI=1.0 and barrier-crystal interface roughness given by σα=20°.

Flood maps and line profiles for each individual interaction depth for a detector with barriers half way through the detector, barrier RI=1.0 and barrier-crystal interface roughness given by σα=20°.