
Figure 2.
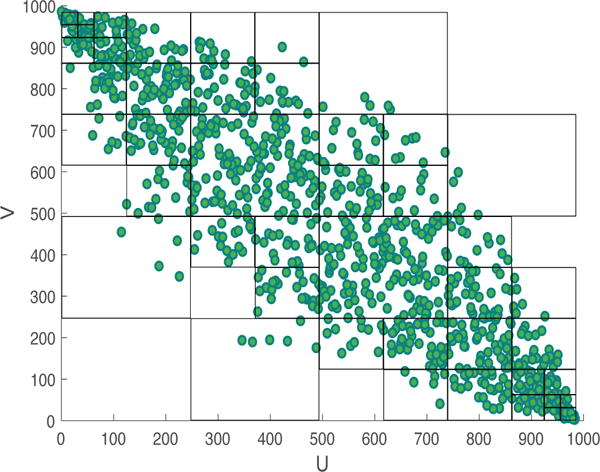
A two-dimensional visualization of DV partitioning. The observation space consists of 1,000 data points sampled from a bivariate Gaussian distribution with σxy = −0.9, , and . The figure shows the observation space after ordinal sampling. It can be observed that densely populated regions in the space have smaller partitions, in comparison to fewer partitions created in sparser areas.