
Figure 3.
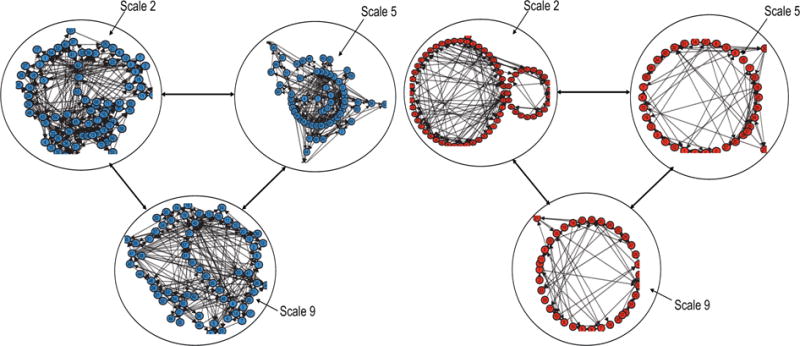
Examples of networks constructed from bivariate time series (HR and MAP) of a control (left panel) and a pre-septic (right panel) patient at different time scales. Within each of the networks, the arrows represent the transition from one node to another.