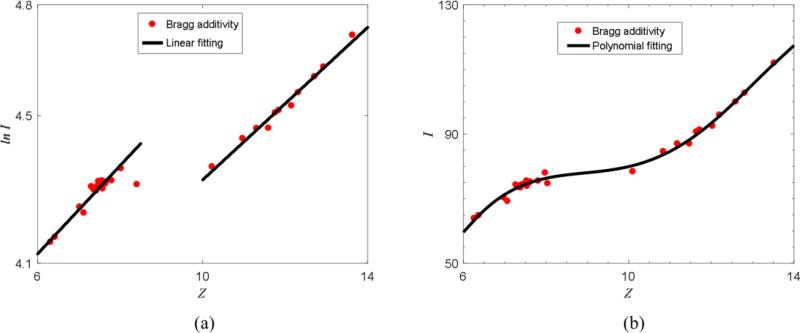
Figure 2.
(a) Empirical linear relationship between Z and ln I observed in human tissues. The dots represent human tissues. The two black lines indicate the linear fitting based on human tissue data points. (b) Polynomial fitting of Z and I proposed by Bourque et al. (2014). Note that the definition of Z is different from Mayneord’s equation.

