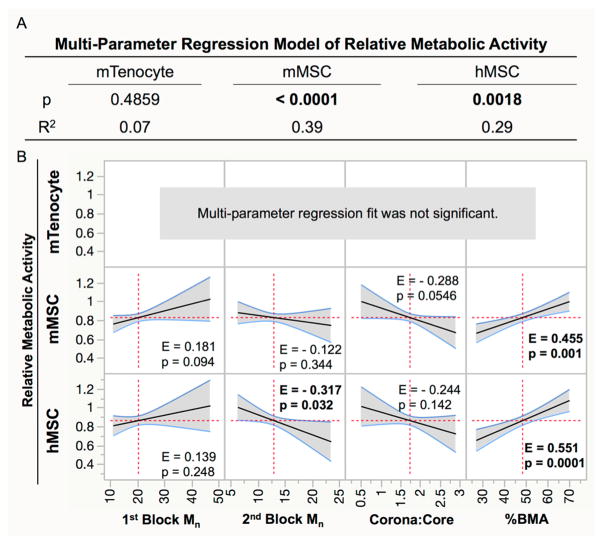
Figure 7.
Relative metabolic activity in treated cells was fit using a multiparameter linear regression to determine if cell viability is dependent on NP properties. (A) p values less than 0.05 (bold) indicate that cell viability is dependent on NP parameters, and the R2 value describes what percentage of the behavior can be adequately described by the predictive model. (B) Effect sizes (E) from significant regression models show the extent that a single property correlates with cell viability. p < 0.05 indicates the polymer property significantly influences cell viability. Significant effects are bolded.

