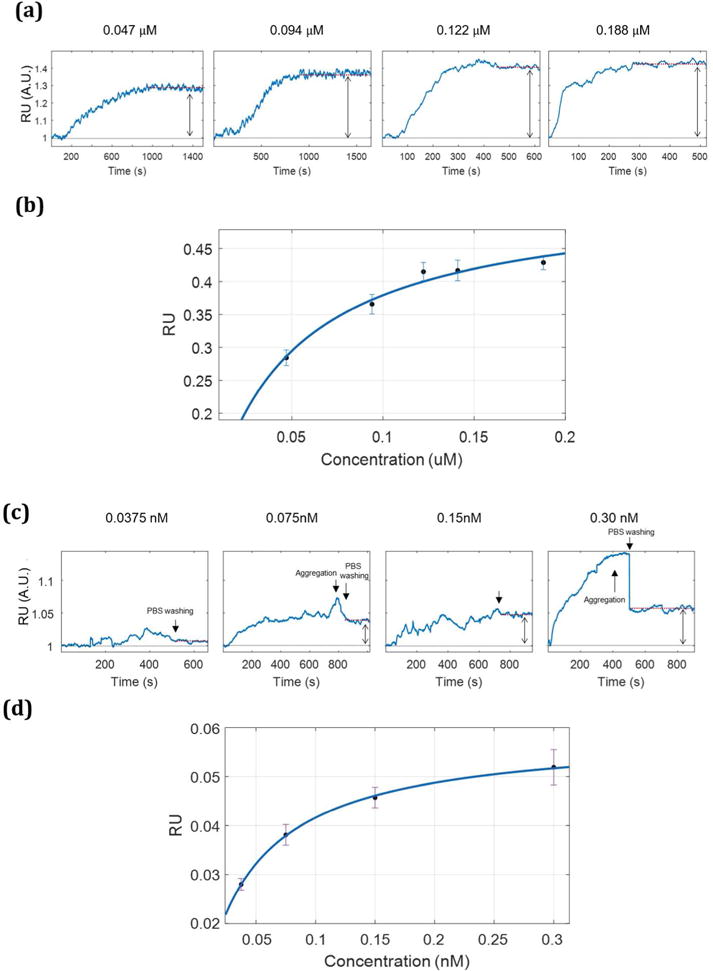
Figure 2.

The SPR sensorgrams in (a) are detected with increasing concentrations (0.047, 0.094, 0.122, and 0.188 μM) of streptavidin solutions. The average reflectivity of each concentration was taken on the plateau of the sensorgram for each concentration (Δ= 0.03±0.01, 0.39±0.01, 0.42±0.01, 0.41±0.02, and 0.43±0.01 RU, respectively). The sensorgrams in (c) are obtained with increasing concentrations STV-NPs (0.030, 0.150, 0.075 and 0.0375 nM) and show the resulting increase (Δ= 0.05±0.04, 0.046±0.002, 0.038±0.002, and 0.008±0.001 RU, respectively). The absorption isotherms shown in (b) and (d) were used to calculate the binding constant using the Langmuir isotherm equation (Supporting information). KA for streptavidin- biotin pair is 2.49 ×10⁷ M−1, and 2.42 ×10¹⁰ M−1 for the STV-NPs to biotin.
