
Figure 7.
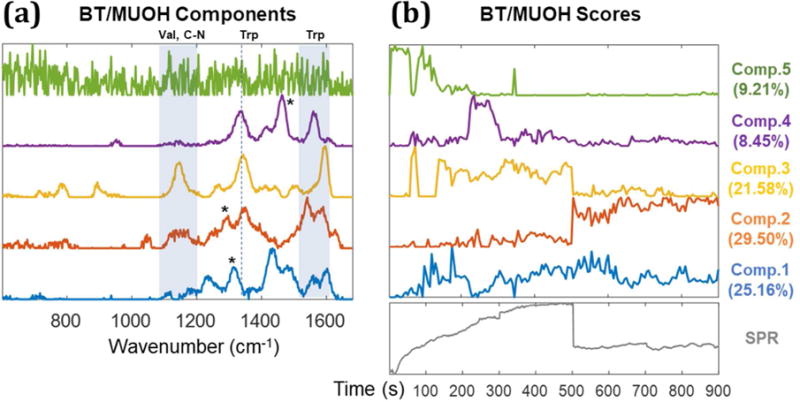
MCR analysis of SERS spectra from STV-NPs on the biotin-MUOH SAM. The original SERS data used for MCR analysis is shown in Figure 4 b. MCR components are illustrated in (a); the peaks from Tryptophan (1335–1350, 1560, and 1590cm−1) are assigned.34 The peaks around 1130–1149cm−1 mainly come from valine and C-N functional group. Asterisks (*) indicate components from CH2 and CH3.34 (b) MCR scores: Component 1 and 2 are attributed to specific binding of biotin and streptavidin and remain after washing. Component 3 and 4, which disappear after PBS washing at 500s, are attributed to components from aggregated nanoparticles. Component 5 is attributed to the background from gold film. The SPR sensorgram is shown below the MCR scores (b) to clarify the correspondence to the SPR experiment.