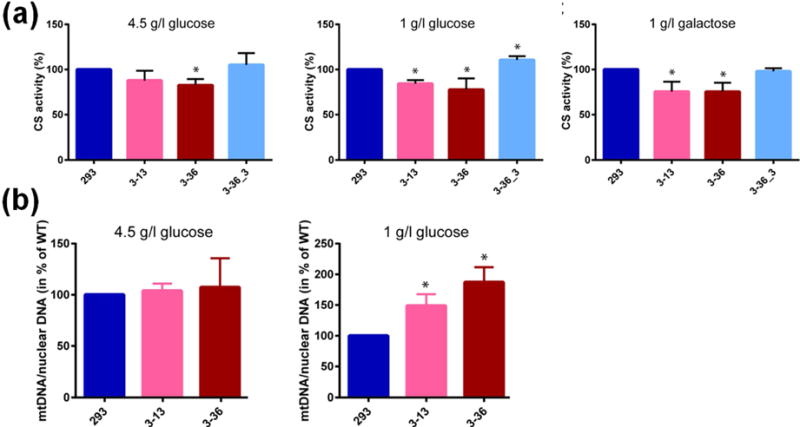
Fig. 4. CS activity and mtDNA copy number in ALKBH1-producing and ALKBH1-deficient clones.

(a) CS activity was measured using lysates from ALKBH1-WT (293), ALKBH1-deficient strains (3–13, 3–36), and Flag-HA-ALKBH1-expressing complemented strain (3–36_3) grown in the media indicated. Data are the mean of three independent experiments and error bars indicate SD. *, P < 0.05 using the Student’s t-test. In the middle panel, the CS activity of strain 3–36_3 was increased over the WT cells in a statistically significant manner. (b) The mtDNA copy numbers of ALKBH1-producing and ALKBH1-deficient clones were calculated by end-point qPCR for cells grown 3 d on 4.5 g/l glucose or 6 d on 1 g/l glucose. DNA concentrations were determined as described [23, 24]. Data are the mean of three independent experiments and error bars indicate SD. *, P < 0.05 according to the Student’s t-test.
