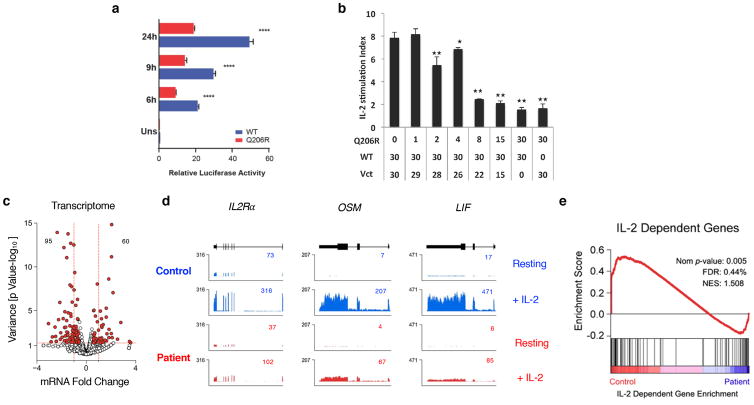
Figure 4.
Mutation Q206R in STAT5B leads to dominant negative effect and dampens IL-2/STAT5 pathway in patient’s T cells.
(a) Dual-luciferase assay of lysates from HEK293T cells transfected with luciferase reporter plasmid containing the IL-2 response element (positive regulatory region III [PRRIII]) from the human IL-2Rα promoter plus pRL-CMV and plasmids encoding WT (blue) or Q206R (red) STAT5B, then treated with 100 IU/mL IL-2 for various times in hours (h) as indicated or unstimulated (uns). **** p=<0.001. (b) Dual-luciferase activity in lysates from HEK293T cells co-transfected with 30 ng of WT, titrations of Q206R STAT5B and normalizing empty vector (Vct) constructs as indicated. IL-2 stimulation index was determined by dividing the normalized luciferase values of IL-2 stimulated cells versus medium controls. Statistical analyses were performed by comparing WT STAT5B only to those with different amounts of Q206R STAT5B, * p<0.05, ** p<0.01. (c) RNA-seq was performed on serum-starved patient T cell blasts treated with 100 IU/mL of IL-2 for 4 hours. Volcano plot shows fold change (log2 transformed) and variance for all transcripts relative to normal controls. Differentially expressed transcripts are highlighted in red. Those with greater abundance in patient (upper left) or controls (upper right) are summed. Dotted red lines indicate 2-fold changes and a p-value > 0.05. (d) Browser tracks show transcripts for selected genes in resting or IL-2-treated cells from the control (blue) or the patient (red). Numbers denote RPKM values for the most detected exon. (e) GSEA plot shows enrichment of IL-2-regulated genes within differentially expressed transcripts. Data are representative of at least three (a–b) and two (c–e) independent experiments.

