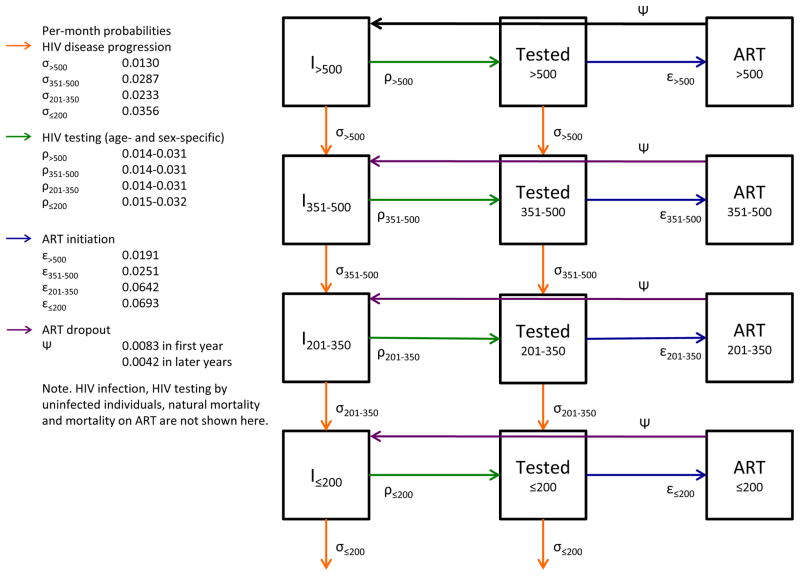
Figure 1.
Simplified model schematic of HIV disease progression and the HIV care cascade among HIV-positive individuals. HIV-positive individuals progress through HIV disease stages and on to HIV-related death at rates σ (top to bottom); subscripts indicate the CD4 cell count category to which the rate applies. Infected individuals (and uninfected, not shown here) are tested at rate ρ, attend clinics for CD4 staging and other clinical tests at and initiate antiretroviral therapy at rate ε. Antiretroviral therapy dropout occurs at rate ψ irrespective of CD4 category at antiretroviral therapy initiation and individuals return to their previous CD4 count unlinked to care.

