
Figure 4. PKM2 levels are elevated in PAH BOECs and in siBMPR2 control BOECs.
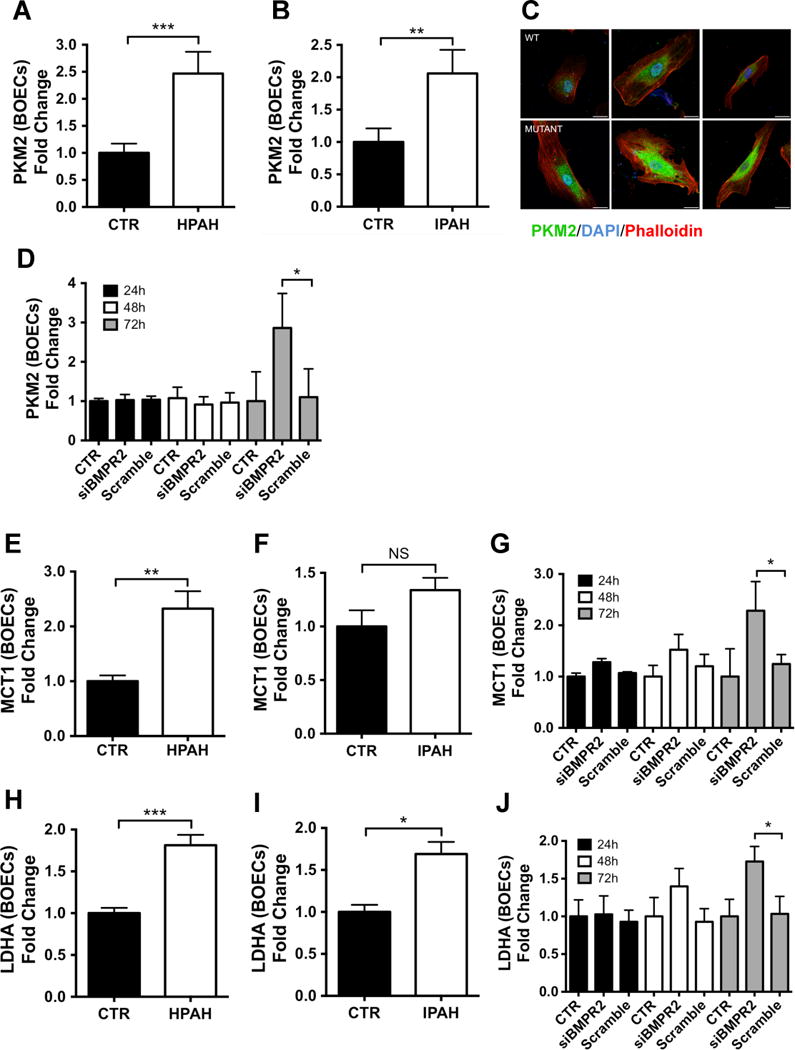
(A–B) The expression of PKM2 was assessed by qPCR in BOECs isolated from HPAH (A, n=7) or IPAH (B, n=5) patients versus controls (n=8). Data were analyzed using an unpaired t-test (***p<0.001, **p<0.01). (C) PKM2 localisation and expression was confirmed by immunofluorescence labeling of PKM2 in HPAH BOECs and control samples (n=3). PKM2 is stained in green; actin was counterstained using phalloidin (red) and nuclei counterstained using DAPI (blue). Scale bars: 25 μm. (D) PKM2 gene expression was assessed in control BOECs (n=3) transfected with siBMPR2 or scrambled siRNA control. Non-transfected cells were used as a negative control (CTR). Data were analyzed using a 1-way ANOVA followed by Bonferroni post hoc test (*p<0.05). (E, F, H, I) Glycolytic factors MCT1 and LDHA were analysed by qPCR in BOECs isolated from HPAH (E, H, n=7) and IPAH (F, I, n=5) versus controls (n=8). Data were analyzed using an unpaired t-test (***p<0.001, **p<0.01, *p<0.05). (G, J) siBMPR2-transfected control BOECs were analysed for MCT1 (G) and LDHA (J) expression levels compared to scrambled control. Cells treated with the transfection reagent alone were used as a negative control (CTR). Data were analyzed using a 1-way ANOVA followed by Bonferroni post hoc test (n=3, *p<0.05). Data are presented as the mean ± S.E.M. Samples were tested in triplicate.