
Figure 6. Upregulation of miR-124 restores the expression of glycolytic genes to control levels.
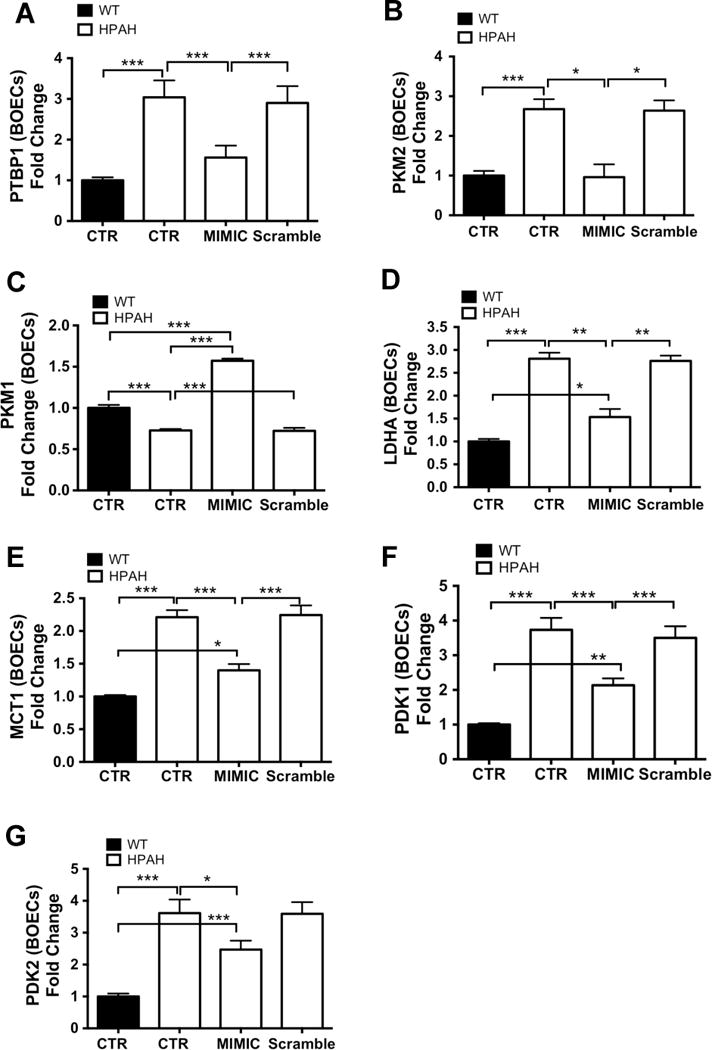
(A–G) HPAH BOECs (n=3) were transfected with a miR-124 mimic or with scrambled control. Cells treated with the transfection reagent alone were used as a negative control (CTR). Total RNA was extracted 48 hours post-transfection and analyzed by qPCR for the expression of PTBP1 (A), PKM2 (B), PKM1 (C) LDHA (D) MCT1 (E), PDK1 (F) and PDK2 (G). Gene expression was also assessed in control BOECs (n=3) to establish the basal level of expression in unaffected subjects. Data are presented as the mean ± S.E.M. Samples were tested in triplicate. Data were analyzed using a 1-way ANOVA followed by Bonferroni post hoc test. (***p<0.001, **p<0.01, *p<0.05).