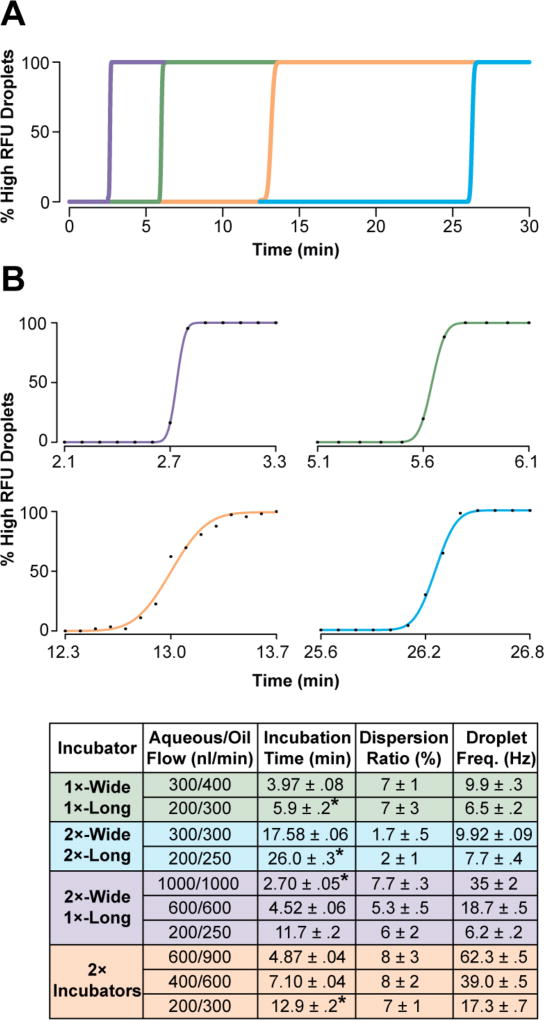
Figure 2. Incubation characterization with ICEcreamer circuit variants.
Droplet incubation times and dispersion ratios were determined by alternating between generation of high- and low-dye concentration droplets, and monitoring the delay in transition between droplet populations at the incubation line terminus. Droplet population transitions were fitted to the Gaussian cumulative distribution function. (A) Representative fits of ICEcreamer variants’ transitions are shown with (B) individual fitted examples of droplet population transition experiments. Incubation times and dispersion ratios of four ICEcreamer circuit variants (150-µm-high incubation channel) were characterized with multiple flow rates. Conditions used in droplet population transition curves are marked with an asterisk.

