Figure 1.
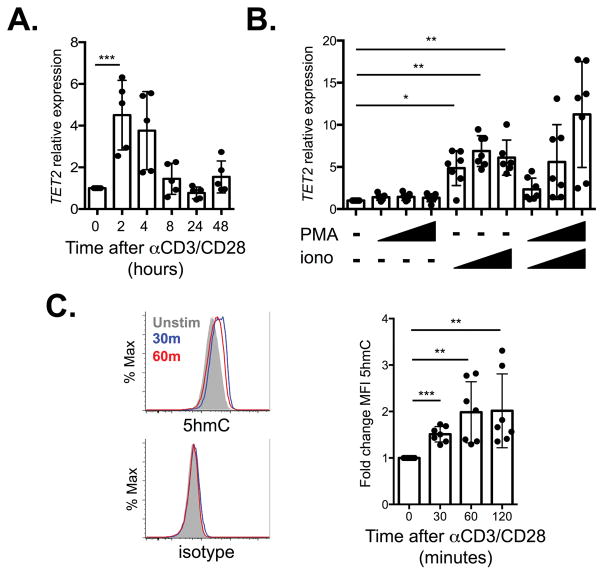
TCR signaling regulates TET2. A) Expression of TET2, relative to β-actin, in cDNA generated from WT T cells stimulated with anti-CD3/CD28 for indicated time periods, normalized to unstimulated cells (n=5, 2 independent experiments). B) TET2 expression, relative to β-actin, in cDNA generated from WT T cells stimulated with increasing concentrations of PMA and/or ionomycin (n=6, 3 independent experiments). C) Left, representative histograms of intracellular 5hmC (top) or isotype control (bottom) in WT T cells stimulated with anti-CD3/CD28 for indicated time periods. Right, fold change in MFI of 5hmC compared to unstimulated cells (n=7, 3 independent experiments). *p<0.05, **p<0.01, ***p<0.001 Dunnett’s multiple comparison test, repeated-measures one-way ANOVA.

