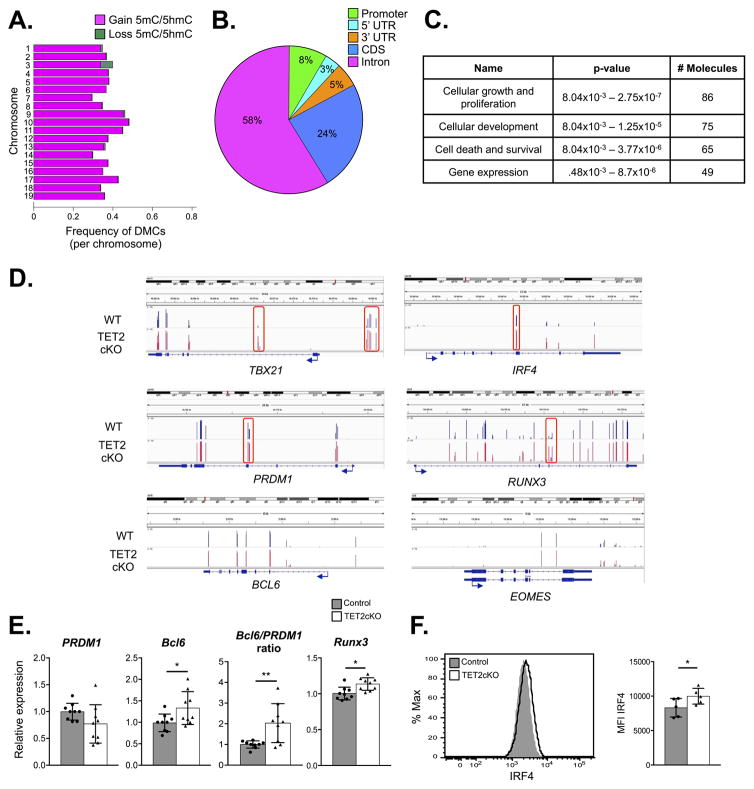
Figure 6.
TET2 loss leads to genomic hypermethylation in LCMV-specific CD8+ T cells. Genomic DNA from control and TET2cKO gp33+ CD8+ T cells on D8 p.i. with LCMV was subjected to ERRBS methylation analysis. A) Stacked barplot showing frequency of differentially methylated cytosines (DMCs) of all covered CpGs per autosomal chromosome. Magenta represents gain of 5mC/5hmC and green represents loss of 5mC/5hmC in TET2cKO versus control samples. B) Pie chart representing proportion of annotated DMRs to indicated regions of genomic DNA. C) Top four molecular and cellular functions of 182 genes containing DMRs analyzed by Ingenuity Pathway Analysis (IPA) software with associated p-values and number of differentially methylated genes grouped into functional categories. D) Integrated Genomics Viewer (IGV) browser visualization of loss of 5hmC/5mC methylation measured by ERRBS at indicated genomic loci from representative control (blue) and TET2-deficient (red) samples. DMRs are boxed in red. E) PRDM1 and Bcl6 expression, relative to β-actin, and ratio of Bcl-6 to PRDM1, and Runx3 expression in cDNA generated from control or TET2cKO CD8+ T cells activated for 3 days with plate-bound anti-CD3/CD28 and IL-2. F) Representative flow cytometric analysis of intracellular IRF4 expression (left) and median fluorescence intensity (right) in control and TET2cKO CD8+ T cells activated for 3 days with plate-bound anti-CD3/CD28 and IL-2. Data representative of n=9/genotype, 3 independent experiments (E), n=5/genotype, 2 independent experiments (F).

